
How to Generate AI Science Diagrams:Molecules and LandformsAnd a Biological Process Hands-On
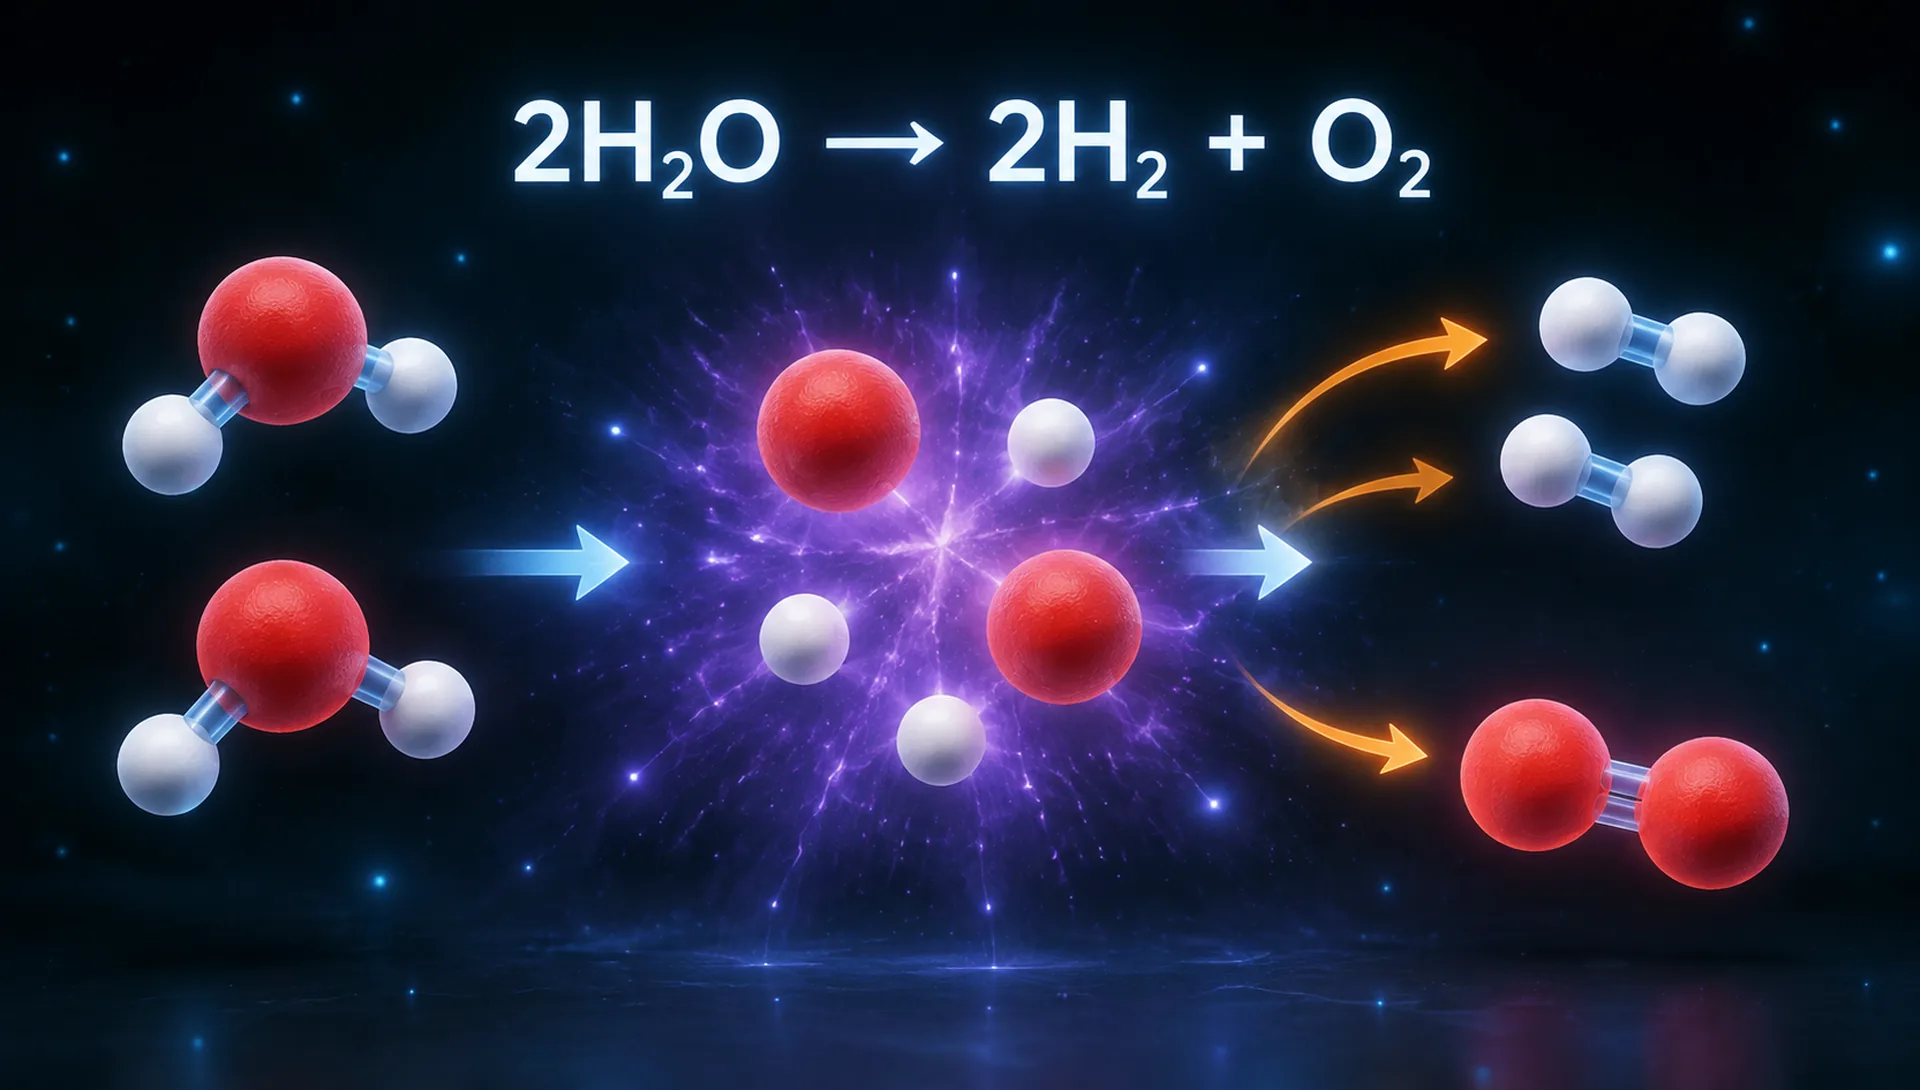
The science diagram prompt formula is “diagram type + staged structure + key feature annotation”: split the evolution into three left-middle-right stages, label each stage’s name and detail elements, then use color to distinguish objects and arrows to mark movement directions — rigor and intuition hold at the same time.
What You’ll Take Away
Chemistry Diagram: The Dynamic Process of Water Decomposition
The spatial arrangement of molecular structures is core content in both scientific research and popular-science communication, abstract and complex at once. Puyo AI captures the key elements of scientific scenes precisely and generates science diagrams with ease. The prompt-writing essentials: define the diagram type and visual presentation requirements, clearly state the scientific elements to show, and highlight the key features to emphasize. Let’s walk through the water electrolysis experiment first.
Step 1: open Puyo AI’s image generation interface, click the “Model” button, set the image model to “Puyo AI Standard”, and enter the prompt in the input box:
Generate a dynamic visualization image showing the decomposition of water into hydrogen and oxygen molecules, minimalist tech style, dark gradient black background dotted with faint light blue glowing particles to simulate the reaction environment. The process is displayed in clear stages: On the left are two ball-and-stick models of water molecules (oxygen atoms are large red matte spheres, hydrogen atoms are small white matte spheres, connected by translucent blue chemical bonds). In the middle, soft purple pulsed glow effects highlight “chemical bond breaking”, with atoms temporarily free. On the right, hydrogen atoms pair up to form two H₂ molecules, and oxygen atoms pair up to form one O₂ molecule. Orange animated arrows mark the movement trajectories of atoms. The reaction equation “2H₂O → 2H₂ + O₂” is labeled beside it in white futuristic sans-serif font. Molecules carry subtle 3D shadows. The whole animation flows coherently, accurately demonstrating the structural changes of molecules during decomposition, with no distracting redundant elements.
How to: set the model to “Puyo AI Standard”, enter the prompt, set the ratio to 16:9, the resolution to 2K, and the number of images to 1, then click “Create”.

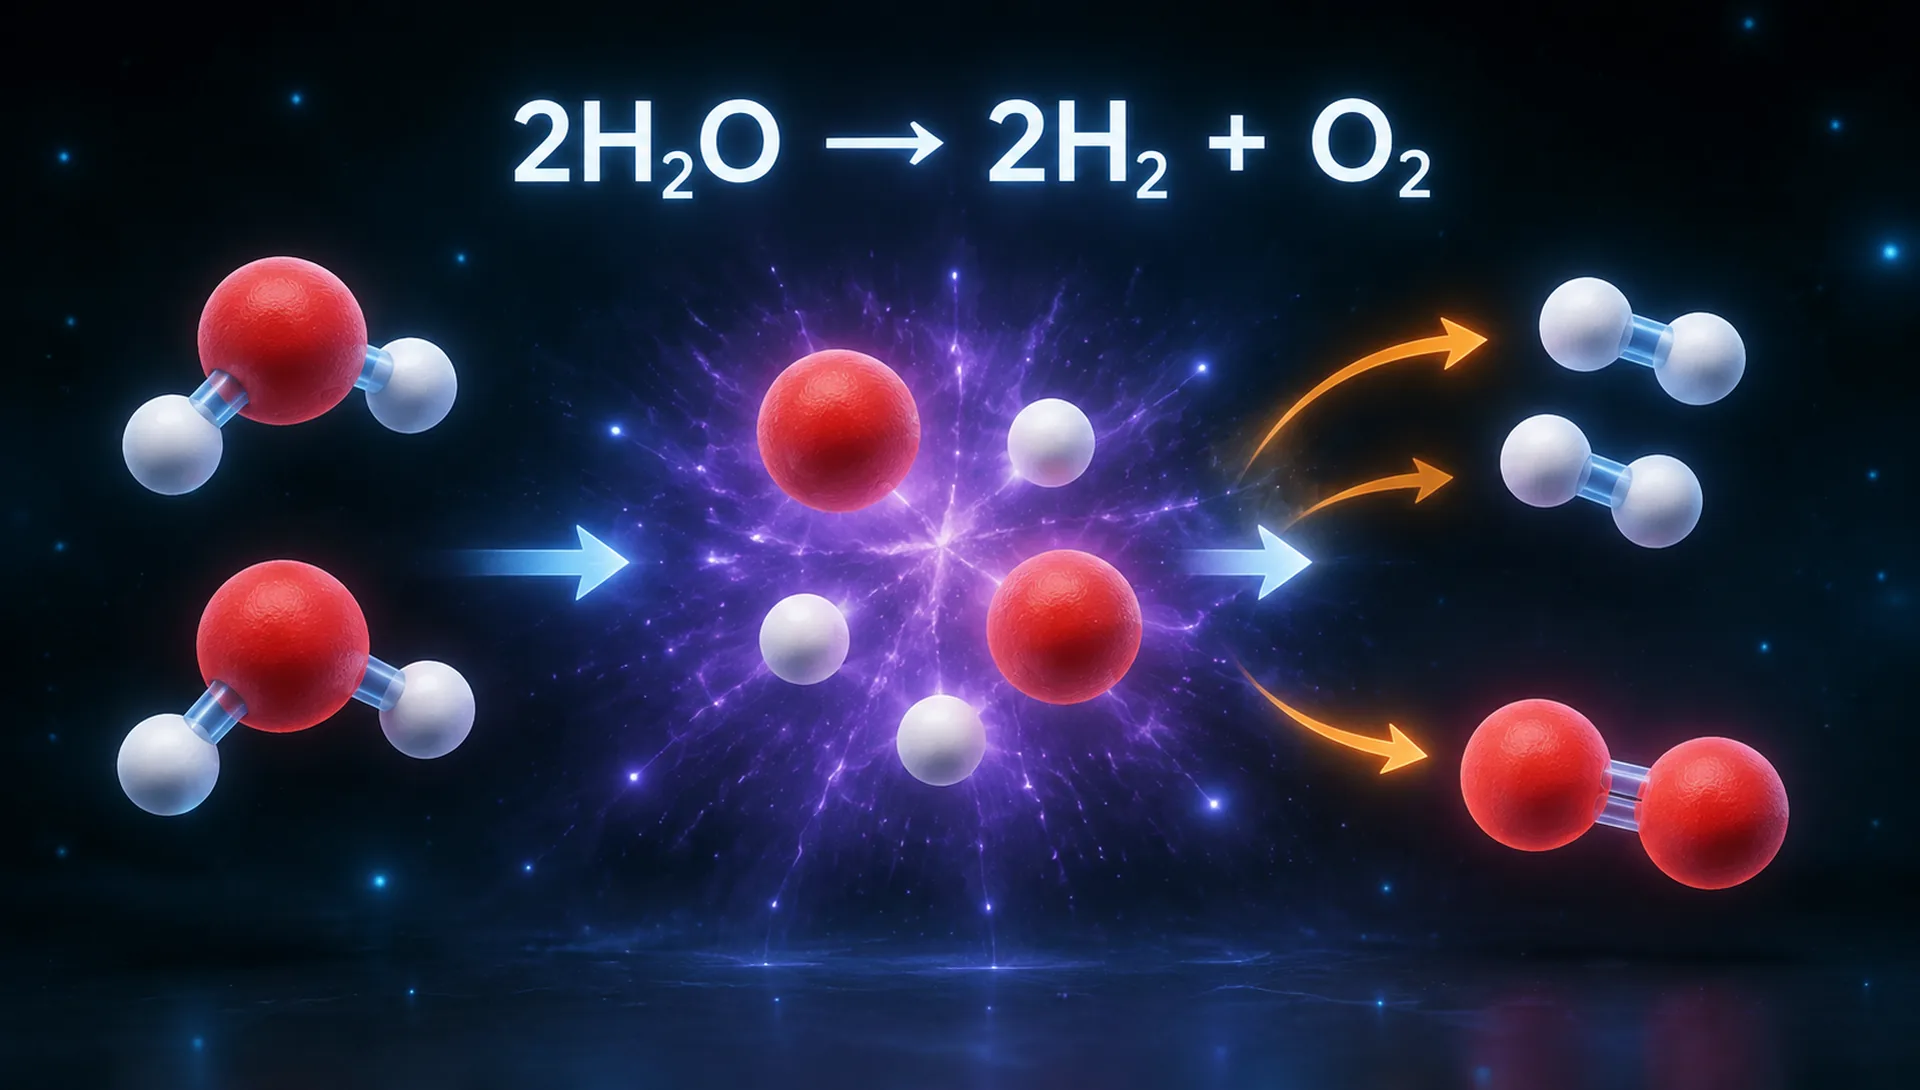
Figure 1-3: Water-Decomposition Diagram — A Three-Stage Layout Makes the Reaction Clear at a Glance
Geography Diagram: Three Stages of a Volcanic Cone Landform
The evolutionary texture of landforms also suits a three-stage layout. Step 1: set the image generation model to “Puyo AI Standard” and enter the prompt in the input box:
Generate a visualization image of the formation process of a volcanic cone landform, realistic science popularization style, with a light gray background and stages displayed in layers. The image shows three steps from left to right: ① Magma (red-orange gradient fluid) surges upward through a crustal fissure, labeled “Magma rising”; ② Volcanic eruption, with magma and volcanic ash (gray particles) ejected outward, labeled “Eruption stage”; ③ Ejected materials cool and accumulate, forming a volcanic cone (dark brown mountain), labeled “Volcanic cone formation”, clearly showing details such as lava flow layers, volcanic ash layers, and crater. Use different color blocks to distinguish crust, magma, and mountain, arrows to indicate the direction of material movement, and gradient shadows to show terrain height, intuitively presenting the geomorphic evolution process.
How to: set the model to “Puyo AI Standard”, enter the prompt, set the ratio to 16:9, the resolution to 2K, and the number of images to 1, then click “Create”.

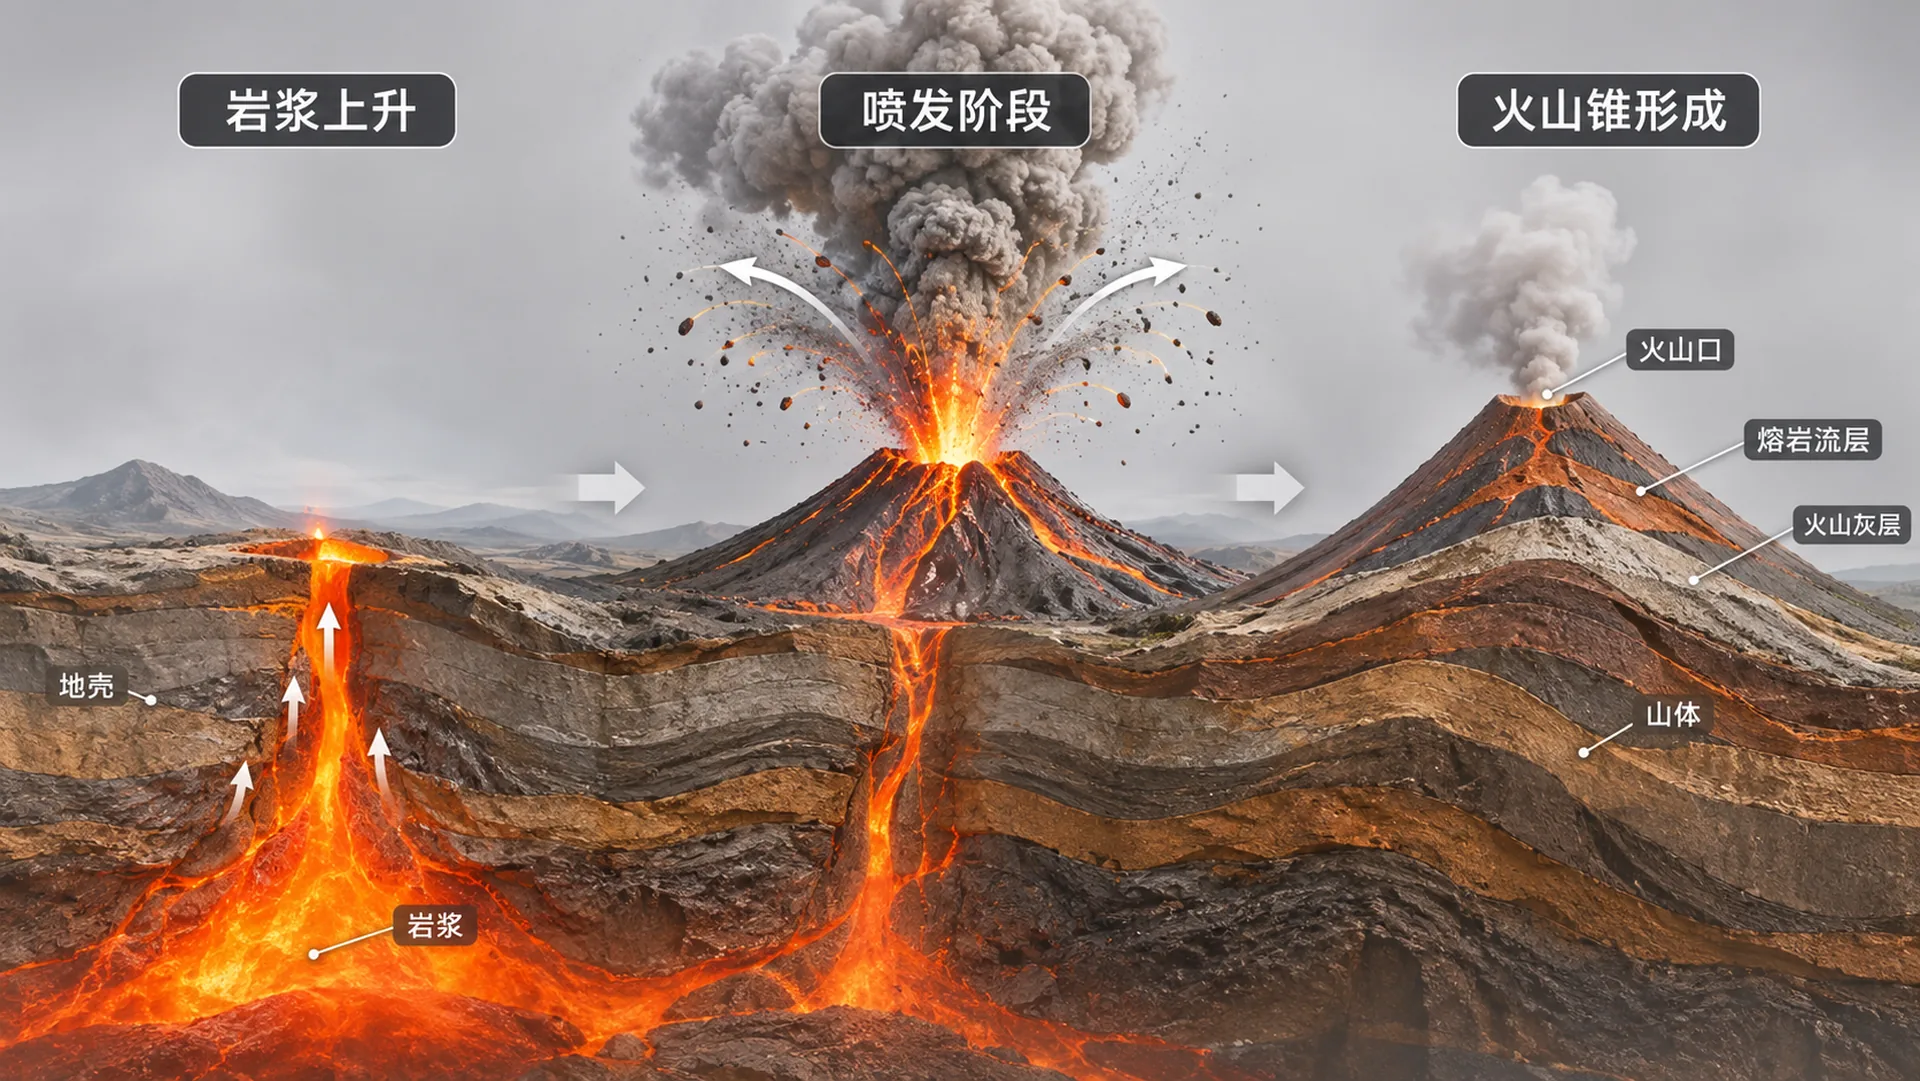
Figure 1-4: Volcanic Cone Diagram — Stage Labels + Color-Block Legend + Arrow Directions
Biology Diagram: The Full Process of Paramecium Feeding
The dynamic mechanism of a biological process tests “structural labeling” the most — the subject’s structures must be fully labeled and the process changes must be readable. Step 1: set the image generation model to “Puyo AI Standard” and enter the prompt in the input box:
Generate a visualization image of the paramecium feeding process, cartoon science style, with a light blue water background dotted with tiny algae. Show a paramecium (transparent pale green, labeled with cilia, oral groove, food vacuole, and anal pore) using the oral groove to sweep in black bacteria—yellow arrows indicate the swinging direction—forming yellow food vacuoles. Inside the food vacuoles, red dots represent digestive enzymes, showing the food decomposition process. Finally, waste is expelled from the anal pore, indicated by gray arrows. Add concise step labels beside the image; paramecium structures are outlined in dark lines. The food vacuoles gradually change color from yellow to light brown during digestion, vividly presenting the complete feeding and digestion process.
How to: set the model to “Puyo AI Standard”, enter the prompt, set the ratio to 16:9, the resolution to 2K, and the number of images to 1, then click “Create”.

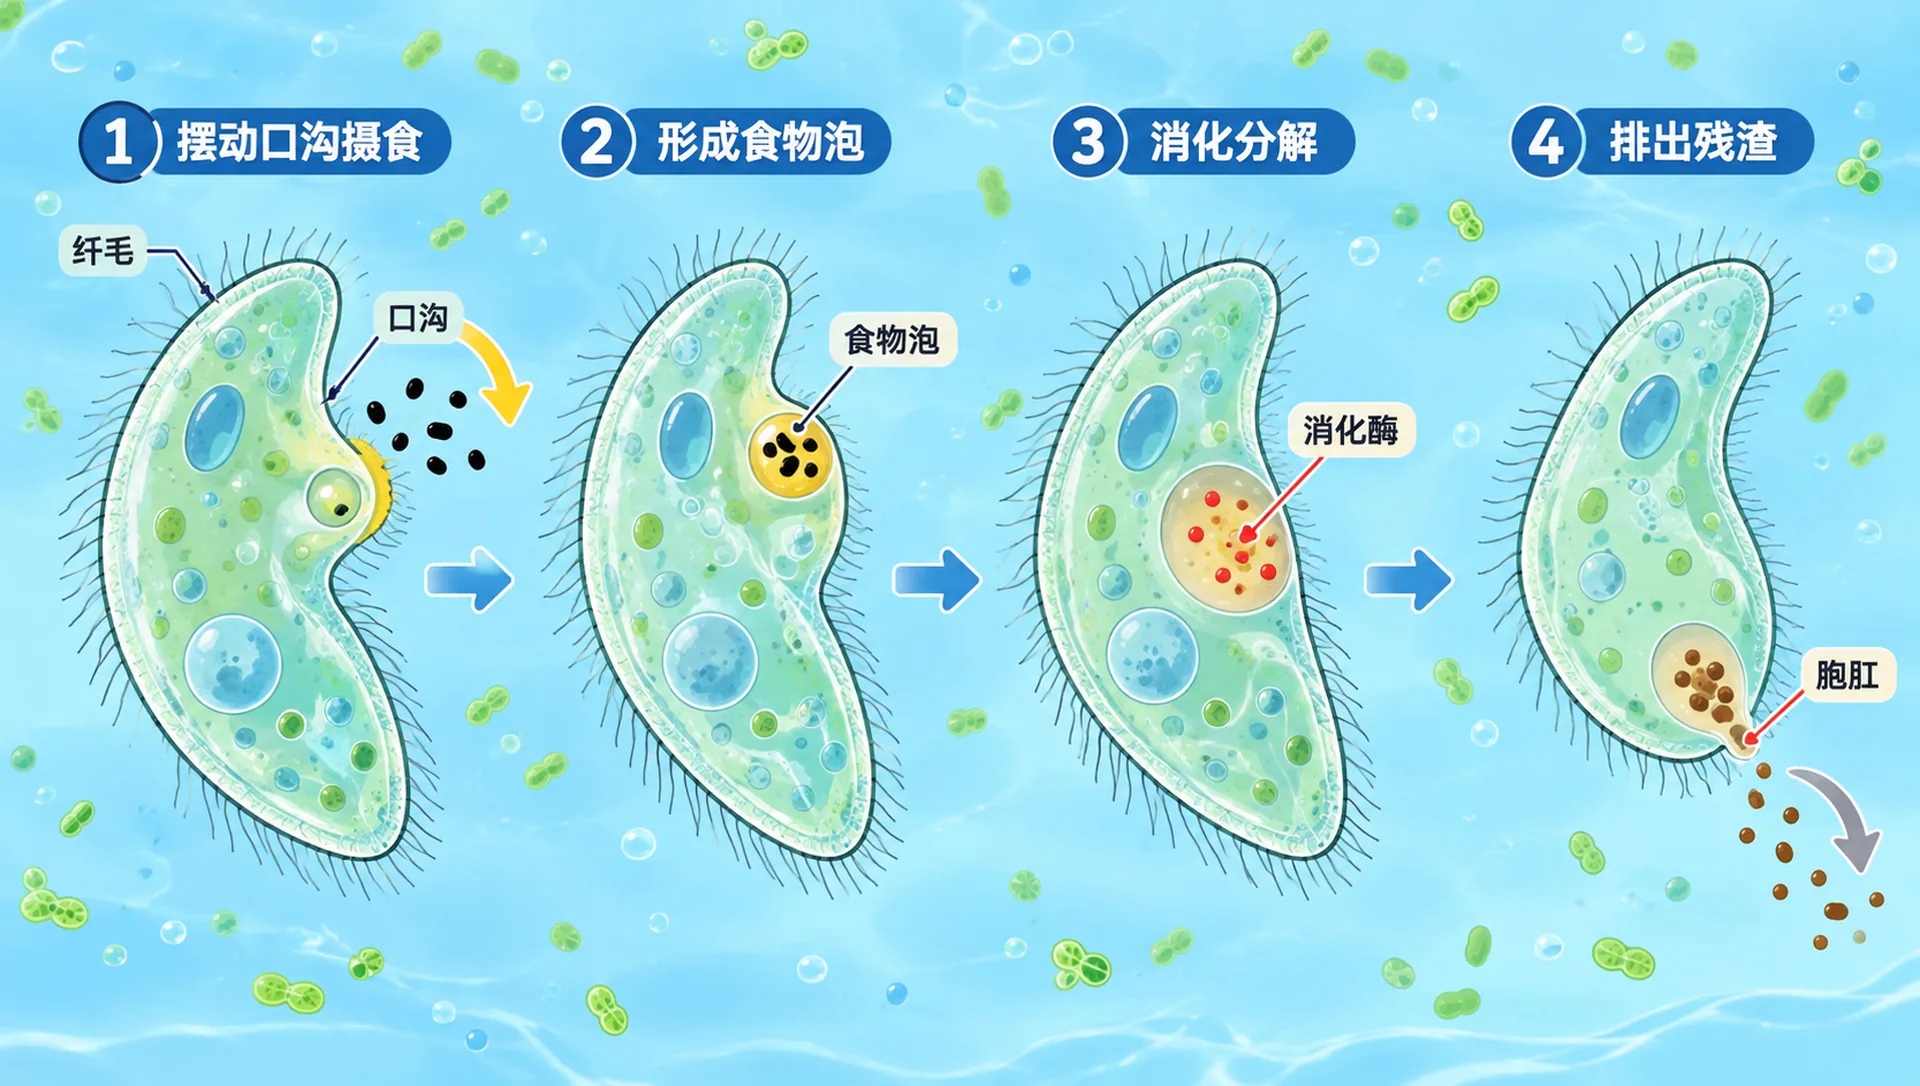
Figure 1-5: Paramecium Diagram — Bracketed Structure Labels + a Color Gradient for Digestion
The clever touch in this image is “the food vacuole gradually changing color as digestion proceeds (yellow → light brown)” — using color change to express the passage of time is a technique unique to biological process diagrams.
The Universal Method for Process Diagrams
Across three subjects, the formula for process-type science diagrams is now clear:Staged Layout(Left-middle-right or ①②③) provide the skeleton,Name Every Element(Atom colors, landform details, biological structures) provide accuracy,Functional Color(Color-block legends, state colors, gradients) provide readability,The Arrow System(Movement directions, trajectories) provide a sense of motion. The next article shifts from science to the humanities — the scene reconstruction of historical events and literary imagery.
FAQFrequently Asked Questions
The questions beginners ask most about this guide
Can AI Draw Microscopic Diagrams Like Molecular Structures Accurately?
Yes, the Key Is to Lock the Structural Rules Down TightThe example specifies “oxygen atoms as large red frosted spheres, hydrogen atoms as small white matte spheres, connected by blue semi-transparent chemical bonds” — with atom colors and bond forms clearly defined, the ball-and-stick model won’t come out wrong.
How Do You Express a Dynamic Process in One Static Image?
Staged Layout + Dynamic ElementsThe example splits water decomposition into three stages — “water molecules on the left → chemical bonds breaking in the middle → hydrogen and oxygen molecules recombining on the right” — then uses “pulse glow effects” and “dynamic arrows marking trajectories” to convey motion — a static image can still tell a whole process.
What Is the Focus of a Landform Evolution Diagram?
Stage Division and Named DetailsThe volcanic cone diagram is arranged in three steps — “magma rising → eruption stage → volcanic cone formation” — and names details like “lava flow layers, volcanic ash layers, the crater”: stages give the skeleton, details give credibility.
How Do You Label a Biological Structure Diagram Clearly?
Write Structure Names into Brackets“Paramecium (transparent pale green, label the cilia, oral groove, food vacuole and anal pore)” — one set of brackets states the subject’s appearance and the required structures in a single go, and AI will place the label text right at the corresponding positions.
What Should You Know About Color in Diagrams?
Color Is the LegendUse different color blocks to distinguish the crust, magma and mountain body, and red/blue arrows to distinguish high vs. low pressure and fast vs. slow flow — every color carries information rather than decoration, so students can read the relationships straight from the image.
What Ratio Suits Science Diagrams?
16:9 Horizontal Is Recommended for Process DiagramsThe left-middle-right staged layout naturally suits a horizontal frame; all three examples use 16:9 + 2K + image count 1, working well for both projection and print.
About the Author: Julia, Veteran AI Image Creator
I have long used AI image generation tools for courseware diagrams, teaching cards and memory aids, and have guided many complete beginners. Every case, prompt, setting and screenshot in this article comes from real generation records on the Puyo AI platform — not theory, not stitched-together stock material. With the three major science diagrams done, the next article moves into humanities scene reconstruction — the visualization of historical events and literary imagery.
Content adapted and polished from the original material “From Novice to AI Art Pro | Complete Hands-On Tutorial Collection”, with all original prompts and figures preserved. Source: https://www.puyoai.com。
Turn Textbook Difficulties into Diagrams
Open the Puyo AI website, pick a scientific process you’re teaching and generate a classroom diagram with the three-stage formula.
Results are affected by model version and randomness—the same prompt will vary slightly each time it runs; run it a couple of rounds before drawing conclusions.