Guides
-
AI Historical Scene Reconstruction and Literary Imagery:The Uprising MomentAnd a Peach Blossom Spring Hands-On
Words in history textbooks always feel one step removed, and the mood of literary works is even more “beyond words”. This article uses two hands-ons — the Dazexiang Uprising and The Peach Blossom Spring — to make the visualization of humanities content work end to end: faithful to historical facts and the text, yet artistically expressive.
-
AI Abstract Concept Visualization:Math DerivationAnd Physics Principle Diagrams
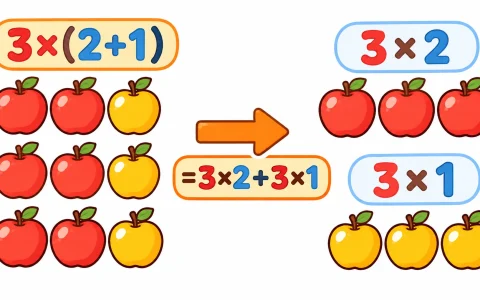
The derivation chain in math and the abstract laws of physics are the hardest parts to teach in class. This article shows two complete hands-ons: how AI turns “3×(2+1)=3×2+3×1” into an apple diagram and Bernoulli’s principle into a vintage science poster — knowledge visualization starts with the hardest abstract concepts.
-
Marketing Campaign Images and Emotional Story Illustrations:Promotional ConversionAnd the Emotional-Resonance Hands-On
A marketing campaign image is the final push toward conversion, an emotional illustration is the amplifier of a story’s feeling — they seem unrelated, but both are built on “letting the picture speak for the words”. This article walks through rational promotion and emotional storytelling with two hands-ons: a new product launch banner and Grandma’s dumplings.
-
Product Display Images and Lifestyle Scene Images:Multi-Angle PresentationAnd a Lifestyle Scene Hands-On
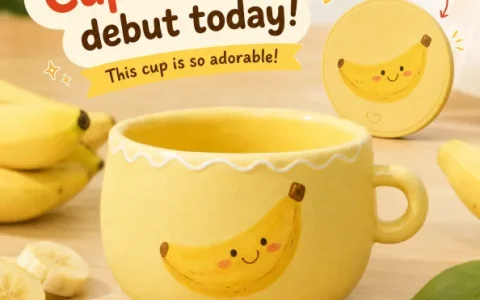
Shoppers can’t touch the real item, so display images and lifestyle scene images become a product’s second face: the former builds trust with five angles, the latter sparks desire with everyday scenes. This article walks through “rational persuasion” and “emotional desire-building” with two hands-ons: the panda sports car and the banana cup breakfast.
-
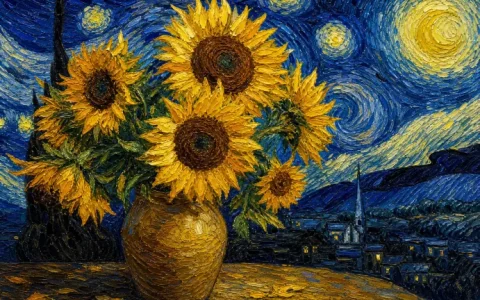
AI Master Painting Styles and Chinese Style:Van Gogh Oil Paintingand Origami Peacock Hands-On Practice
The last stop in artistic interpretation: honoring the masters and drawing on tradition. Van Gogh’s swirling strokes, Qi Baishi’s ink-wash charm, the precision of folded paper, the silks of Dunhuang’s apsaras—this piece closes the entire Visual Presentation series with two hands-on cases.
-
AI Fun Creativity and Classic Art:Miniature Cityand Ukiyo-e Hands-On Practice
Earlier pieces were about “recreating”; this one starts “creating”: first a playful miniature city, then an upgrade to the six-element artistic interpretation formula, using ukiyo-e to recreate a classic—the prompts get finer-grained and the results more refined.
-
AI Architecture Photography and Creative Figures: Great Wall Aerial Shot and ID Photo in Practice
Architecture is the subject that tests spatial awareness most in photography simulation, while people are the most versatile canvas for visual creation. This piece closes out the photography-simulation series with a landmark aerial shot, then moves into visual creation—one four-part formula takes you all the way from formal ID photos to chibi avatars.
-
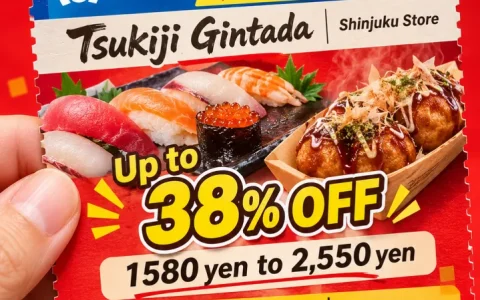
How to Make Promo Coupons and Character Breakdown Sheets: AI Everyday-Design Prompt Templates
Opening a store means needing a promo coupon; drawing characters means needing a design breakdown—these non-standard image requests mean high design-agency costs and fiddly DIY layout. Puyo AI gets it done with two prompts, and both templates in this guide are copy-ready word for word.
-
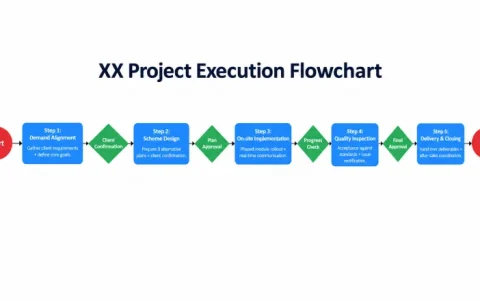
How to Generate Project Timeline Charts and Flowcharts: AI Project Visualization Prompt Templates
The scariest part of a project report is failing to explain “what comes first, what comes next, and what hands off to what”. Timeline charts handle sequencing and milestones, flowcharts handle task flow and handoffs—this guide’s two templates are copy-ready, turning your project steps into one image everyone understands.
-
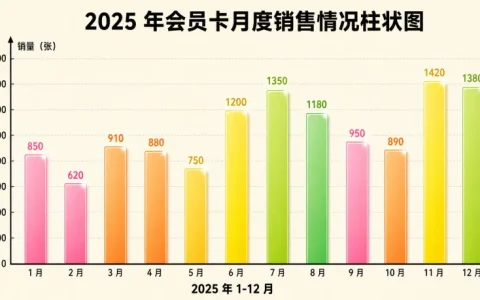
How to Generate Bar Charts and Pie Charts with AI: Sales Data Visualization Prompt Templates
Comparing values and showing shares are the two most common charting needs at work. This guide gives you two copy-ready prompt templates—bar charts for size comparisons and donut pie charts for share breakdowns—so you can swap in your own data and get a chart right away.