
How to Generate Bar Charts and Pie Charts with AI: Sales Data Visualization Prompt Templates
Bar charts handle “category comparisons”, pie charts handle “part-to-whole shares”. The fixed prompt structure: name the chart type up front → write the X-axis, Y-axis, and data item by item → describe the bars’/sectors’ colors and texture → background grid and title → close with overall style. Copy both templates and swap the data; ratio 16:9, 2K, 1 image.
What You’ll Take Away from This Guide
Bar Chart: Monthly Membership-Card Sales Case
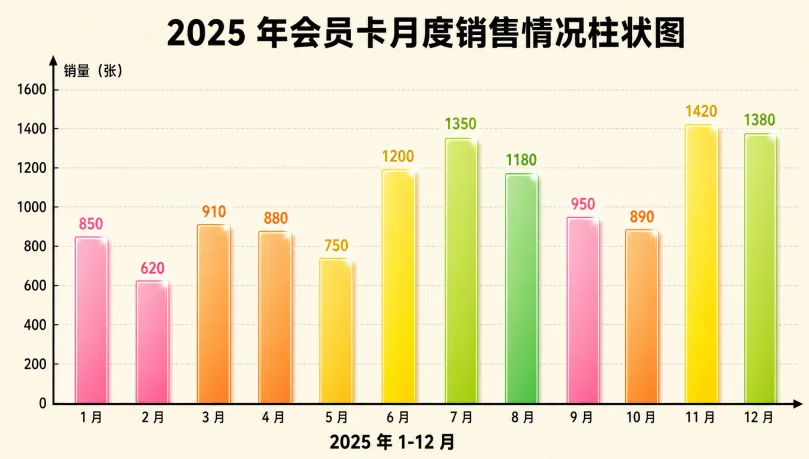
In daily work and study, bar charts and pie charts are fundamental, practical chart types: the former intuitively compares value differences across categories, and the latter clearly shows each part’s share of the whole. Puyo AI can generate both chart types in a well-formatted style from a plain data description. Start with the bar chart—month-by-month membership-card sales, twelve months of data rendered as gradient bars with the busy season obvious at a glance:
Bar chart for monthly membership card sales. X-axis labeled "Jan-Dec 2025", Y-axis labeled "Sales Volume (Cards)". Data: Jan 850, Feb 620, Mar 910, Apr 880, May 750, Jun 1200, Jul 1350, Aug 1180, Sep 950, Oct 890, Nov 1420, Dec 1380. Gradient colors for bars, alternating pink, orange, yellow and green, subtle glossy texture on each bar. Light beige background with fine grid texture. Clearly labeled axes with units. Bold title: "Bar Chart of Monthly Membership Card Sales in 2025". Light gray horizontal grid lines. Lively and professional style, high definition.
How to: open the image generation page, set the model to “Puyo AI Standard”, enter the prompt, set the ratio to 16:9, the resolution to 2K, and the number of images to 1, then click “Create”.
Here is what the generation returned—the two peaks of November’s 1,420 and December’s 1,380 jump out immediately, and the mid-year June–August summer mini-peak is just as clear:
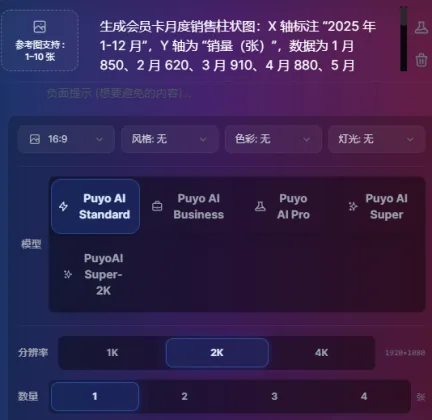
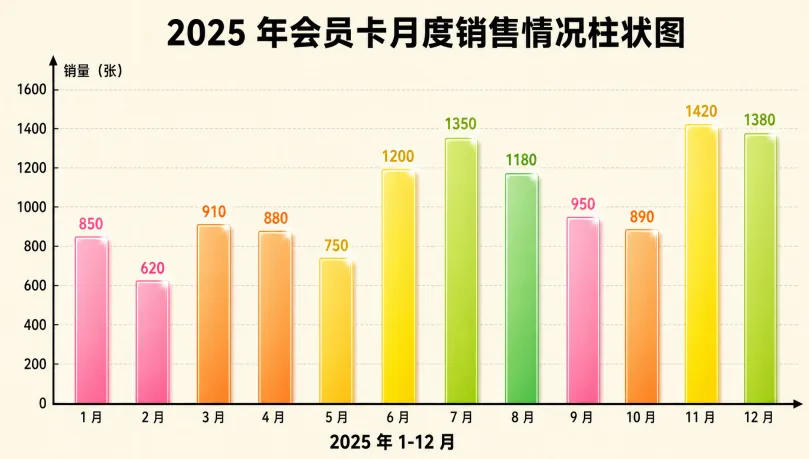
Fig. 1-8 Generating the monthly membership-card sales bar chart
Pie Chart: Book Sales Channel Share Case
Now the share scenario—the composition of book sales channels. The four channels’ shares are rendered as a donut pie chart: the blank center reads more modern, each sector takes its assigned channel color, and the legend on the right pairs colors with names for a fully standard-compliant look. Note that the shares in the prompt sum to 100%—that “part-to-whole” kind of data is exactly what pie charts are for:
Donut pie chart showing the proportion of book sales channels, four categories: Online E-commerce 55%, Offline Bookstores 25%, Group Buying via Communities 12%, Campus Cooperation 8%. Sector colors: Online E-commerce in blue, Offline Bookstores in green, Group Buying via Communities in orange, Campus Cooperation in purple. Thin white borders on each sector edge. Each sector is labeled with channel name and percentage, bold 12pt font. Donut style with blank center. Light gray background with subtle frosted texture. Chart title: Book Sales Channel Proportion Analysis (2025). Legend placed on the right side of the chart with matching colors and channel names. Simple business style, clear and intuitive, neat colors, high definition.
How to: set the model to “Puyo AI Standard”, ratio 16:9, resolution 2K, 1 generated image, then click “Create”.
Here is the finished chart—the blue 55% online e-commerce sector takes over half the ring, and the hierarchy of channels is crystal clear:
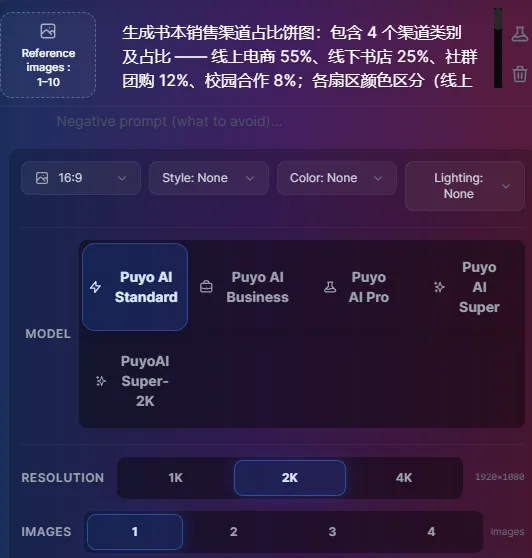
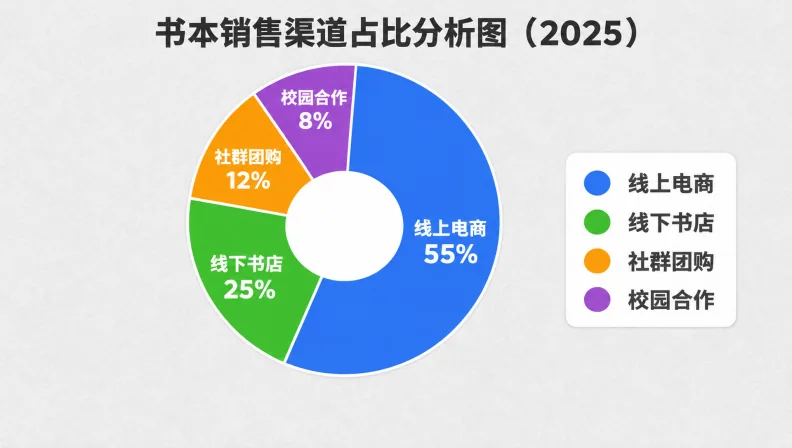
Fig. 1-9 Generating the book sales channel share donut chart
How to Adapt Both Templates to Your Own Data
Both templates share the same skeleton; change three spots to reuse them: swap the data section for your own dimensions and values (write each item out—don’t just say “monthly sales”); adjust the color section to your brand palette or scene (the bar chart’s gradient order, the pie chart’s per-sector colors); and retitle the title section with your chart’s name. If your data dimension isn’t 12 months but quarters, channels, or stores, just sync the X-axis labels and the data items.
Needs beyond data—say, turning a full-year sales trend into a phased rollout plan—call for timeline charts and flowcharts; the next guide hands you ready-made prompt templates for project timeline charts and flowcharts.
FAQFrequently Asked Questions
The questions beginners ask most about this guide
When should I use a bar chart versus a pie chart?
It depends on what the data needs to say: use a bar chart to compare values across categories (e.g., month-by-month sales), and a pie chart to show each part’s share of the whole (e.g., channel mix). You can also make both from the same dataset—bars for comparison pages and a pie for the summary page in your report.
Do I have to list every month of data?
Listing everything is recommended. Write the items out one by one, like “Jan 850, Feb 620”, so the AI draws true proportions and the chart is accurate; if your months differ, write what you actually have—the baseline is a clearly stated dimension-to-value relationship.
Flat pie or donut?
Donut is recommended. A donut pie chart with a blank center looks more modern, and labels placed beside each sector are easier to read; the case in this guide uses the donut design with thin white borders on every sector, so categories and percentages are clear at a glance.
How do I write colors without making the chart cluttered?
Constrain rules instead of listing heaps of colors. For the bar chart write “gradient colors alternating in sequence”; for the pie chart assign a color per channel (online blue, bookstore green, group-buy orange, campus purple), then add “vivid colors, not cluttered” as a catch-all.
What aspect ratio and resolution should I set?
16:9 + 2K. Both charts are landscape presentation pieces that fit slide decks and article illustrations alike; set the number of images to 1, and rerun the original prompt for another round if you are not satisfied.
Will the generated numbers be inaccurate?
The chart is exactly as accurate as the data written in your prompt. The AI draws from the values you provide, but if key figures must be presented precisely, zoom in and verify the data labels after generation; fix any blurry spots by editing the prompt and regenerating.
About the Author: Julia, Veteran AI Image Creator
Julia has long used AI image tools for avatars, illustrations, productivity diagrams, and character design, and has coached large numbers of complete beginners. Every case, prompt, parameter, and screenshot in this article comes from real generation records on the Puyo AI platform—not theoretical speculation, not stitched-together stock. This is the first hands-on guide in the chart series; for project-progress charts, see the next guide on timeline charts and flowcharts.
The content is adapted and polished from the original material “From Novice to AI Art Pro | Complete Hands-On Tutorial Collection”, with all original prompts and figures preserved. Source: https://www.puyoai.com.
Templates in Hand—Swap In Your Data and Go
Open the Puyo AI website, swap these two templates onto your data, and get a chart in a minute.
Results are affected by model version and randomness—the same prompt will vary slightly each time it runs; run it a couple of rounds before drawing conclusions.