How to Generate Project Timeline Charts and Flowcharts: AI Project Visualization Prompt Templates
Timeline charts list nodes by “stage name + time range + stage tasks”, in a horizontal layout with colorful node icons; flowcharts write out the logic chain “Start → Step 1 → … → End” with nodes colored by shape: red circles for start and end, blue rounded rectangles for execution, green diamonds for decisions, black arrows for flow direction. Both are 16:9, 2K, 1 image.
What You’ll Take Away from This Guide
Timeline Chart: Five-Stage Project Implementation Case
A clear flow is the key to running a project efficiently: a timeline chart visually presents the sequence and milestone nodes of each stage. The trick to the prompt is writing all three elements of every stage—step name, time range, and what happens in that stage. Here is the complete prompt for a business-style project timeline chart:
Business-style horizontal project timeline, title [XX Project Implementation Timeline]. 5 core stages in chronological order: 1. Project Initiation: Mar–Apr 2025, complete demand research and finalize the plan; 2. Resource Preparation: May–Jun 2025, team formation and material procurement; 3. Core Implementation: Jul–Oct 2025, phased rollout; 4. Optimization & Iteration: Nov 2025, data review and adjustment; 5. Project Closure: Dec 2025, result acceptance and summary. Main timeline is a blue gradient line, 2px width. Colored circular markers for each stage: green for initiation, yellow for preparation, orange for implementation, purple for optimization, red for closure. Stage name and time range next to each marker. Light beige background with fine grid texture. Bold centered title, horizontal layout, concise descriptions, distinct color coding, professional business design, for project presentation, high definition.
How to: open the image generation page, set the model to “Puyo AI Standard”, enter the prompt, set the ratio to 16:9, the resolution to 2K, and the number of images to 1, then click “Create”.
Here is the generated result—five stages unfold along the blue gradient time axis, and the green, yellow, orange, purple, and red nodes draw out the sense of momentum “from kickoff to closure”:
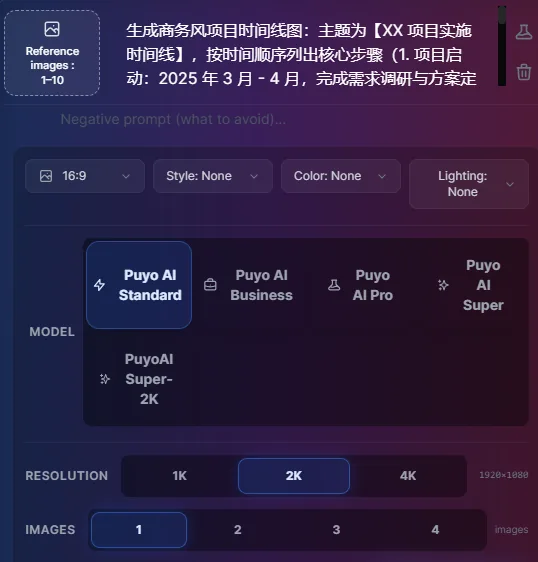
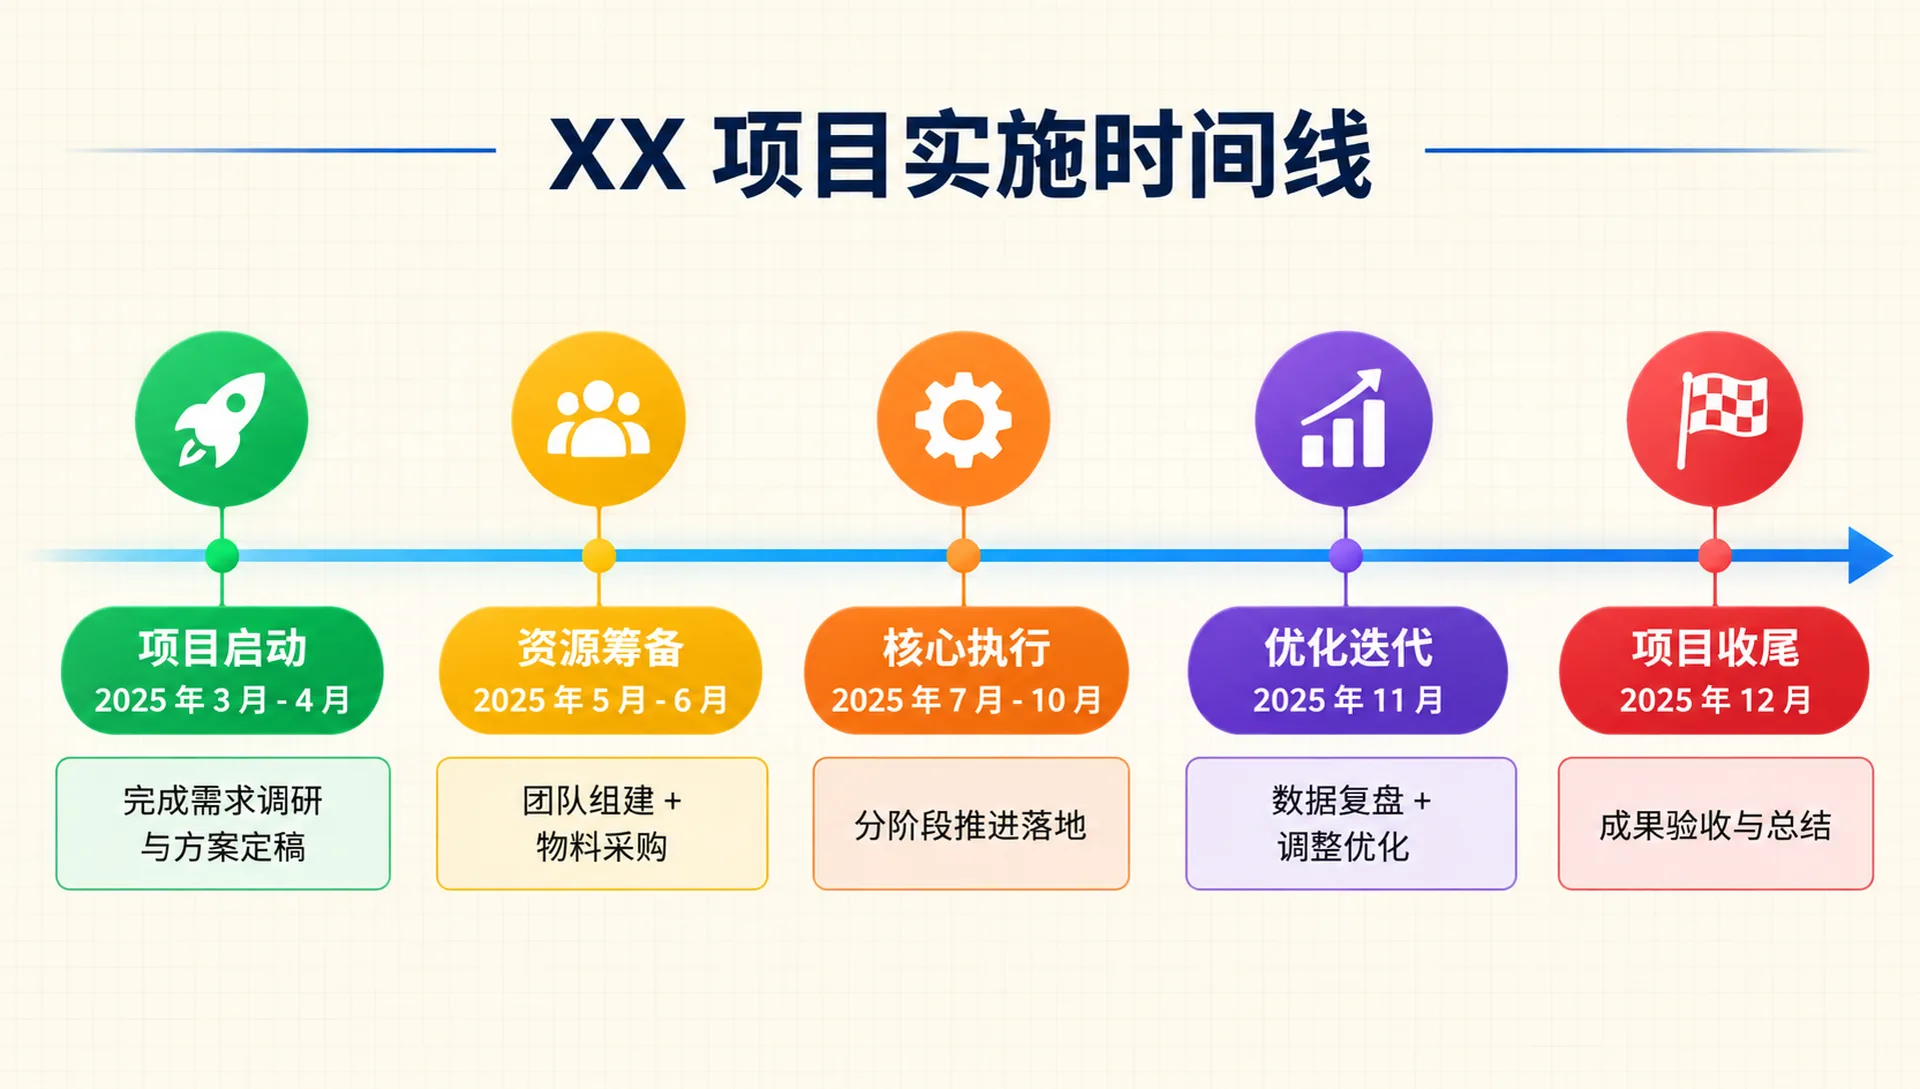
Fig. 1-10 Generating the business-style project timeline chart
Flowchart: Five-Step Project Execution Case
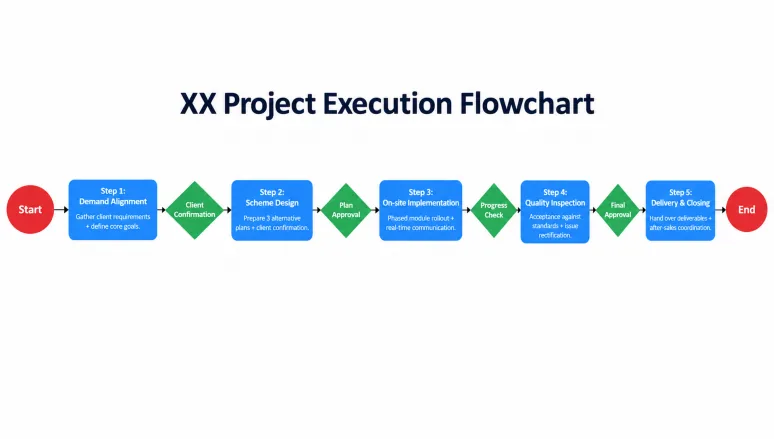
When you need to explain the task flow logic and connection order, use a simple flowchart. The key to the prompt is writing the logic chain in one breath—”Start → Step → Step → … → End”—and assigning a shape and color to each node type. This color scheme is universal flowchart semantics: red circles for start and end, blue rounded rectangles for execution, green diamonds for decisions, black solid arrows for flow direction:
Simple and clean horizontal project flowchart, title [XX Project Execution Flowchart]. Flow logic: Start → Step 1: Demand Alignment (gather client requirements + define core goals) → Step 2: Scheme Design (prepare 3 alternative plans + client confirmation) → Step 3: On-site Implementation (phased module rollout + real-time communication) → Step 4: Quality Inspection (acceptance against standards + issue rectification) → Step 5: Delivery & Closing (hand over deliverables + after-sales coordination) → End. Red circles for Start and End nodes; blue rounded rectangles for execution steps; green diamonds for decision nodes; black solid arrows to indicate flow direction. Each node labeled with step name plus brief description (within 10 words). Clean color palette, pure white background, bold centered title, horizontal layout, coherent logic, no extra decorations, professional minimalist style, for work report and team collaboration, high definition.
How to: set the model to “Puyo AI Standard”, ratio 16:9, resolution 2K, 1 generated image, then click “Create”.
Here is the finished chart—the five steps from demand alignment to delivery and closing spread horizontally with clear arrow flow, ready to drop straight into a project document:
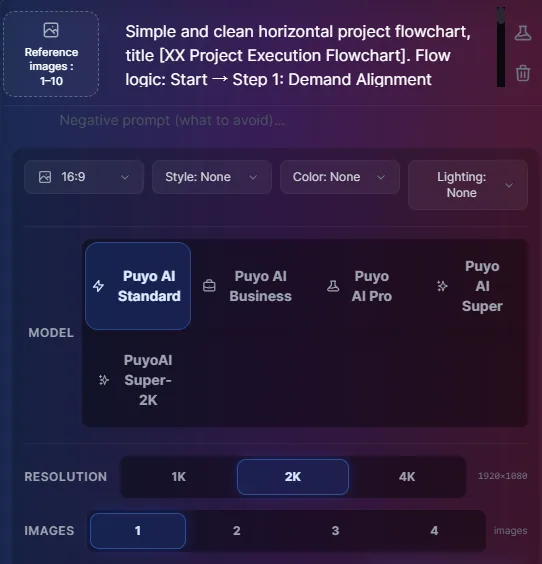
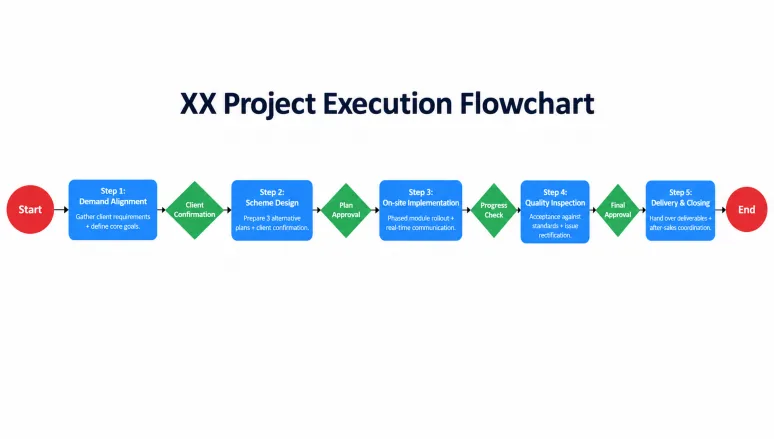
Fig. 1-11 Generating the simple, clean project flowchart
What to Change When Adapting It to Your Project
Both templates reuse with two edits: swap the content section for your project’s real stage names, time ranges, and stage tasks (timeline chart), or your real step chain with per-step notes (flowchart); and in the subject placeholder replace [XX Project] with the project name. Adjust the node count to reality—5 to 7 nodes reads clearest in a horizontal layout; for branches, use green diamond nodes in the flowchart and spell out the condition.
Beyond charts, everyday life needs visuals too—limited-time promo coupons, character design sheets, and other non-standard requests; the next guide hands you ready-made prompts for promo coupons and character breakdown sheets.
FAQFrequently Asked Questions
The questions beginners ask most about this guide
What’s the difference between a timeline chart and a flowchart?
They emphasize different things: a timeline chart stresses “what happens when”, presenting each stage’s sequence and milestone nodes in chronological order; a flowchart stresses “how steps connect”, precisely mapping task flow logic and order. Project reports favor timelines; operating guides favor flowcharts.
Must node colors follow the template exactly?
The rules matter more than the specific colors. The template’s intent is that different node types are distinguishable at a glance: one color of circular icon per timeline stage, and start/end, execution, and decision nodes in distinct shapes and colors in the flowchart. You may swap the palette, but keep “one color per node type”.
Is there a limit on the number of steps?
No hard limit, but keep it lean. The template uses 5 stages/5 steps; in a horizontal layout 5–7 nodes read most clearly. Beyond 10 nodes, split into two charts or merge similar steps—otherwise the shrinking text hurts readability.
What does the diamond decision node mean?
The diamond is standard flowchart semantics. In flowchart conventions, a diamond marks a judgment branch (yes/no takes different paths); the case in this guide is a single-line progression, so the green diamond is kept as a standard element in the legend system—when you need a branch, write the condition into the node description.
Can I put my project name directly into the prompt?
Yes, or leave a placeholder. The template uses [XX Project Implementation Timeline] as a subject placeholder; just replace it with your real project name. For confidential projects, use a code name—chart structure and expressive effect are unaffected.
Can the time range be written in months only?
Yes. The template writes to the month in the “Mar–Apr 2025” format; choose the granularity by project: months for long projects, weeks or days for short sprints—just keep the format consistent.
About the Author: Julia, Veteran AI Image Creator
Julia has long used AI image tools for avatars, illustrations, productivity diagrams, and character design, and has coached large numbers of complete beginners. Every case, prompt, parameter, and screenshot in this article comes from real generation records on the Puyo AI platform—not theoretical speculation, not stitched-together stock. This is the second hands-on guide in the chart series; for everyday image needs, see the next guide on promo coupons and character breakdown sheets.
The content is adapted and polished from the original material “From Novice to AI Art Pro | Complete Hands-On Tutorial Collection”, with all original prompts and figures preserved. Source: https://www.puyoai.com.
Project Chart Templates, Ready to Use
Open the Puyo AI website and turn your project plan into a timeline chart.
Results are affected by model version and randomness—the same prompt will vary slightly each time it runs; run it a couple of rounds before drawing conclusions.
Original article by Julia,Please credit the source:https://www.puyoai.com/blog/ai-timeline-flowchart-prompts-en.html