
Why Puyo AI Is Especially Good at Charts: Three Core Capabilities Explained
Puyo AI’s charting strength rests on three things: Gemini 3 Pro-driven layered logical reasoning, crisp readable chart text that never blurs, and a chart matrix covering the basic, combined, and professional statistical families. Logic governs “are the relationships right”, text governs “is it readable”, and presentation governs “does it fit the scenario”—a chart is professional only when all three are in place.
What You’ll Take Away from This Guide
Capability 1: Outstanding Understanding of Logical Relationships
A chart’s core value is making complex information, logic, or data intuitive and easy to understand, and the foundation of that step is logic understanding. As a model driven by Gemini 3 Pro, Puyo AI has a unique thinking mode: faced with a complex prompt, it first reasons in layers—mapping the inherent connections between pieces of information, then planning the chart’s logic, eliminating cluttered charts and misaligned relationships at the root. Look at a project timeline chart it generated: the sequence of five stages and the milestone nodes read at a glance:
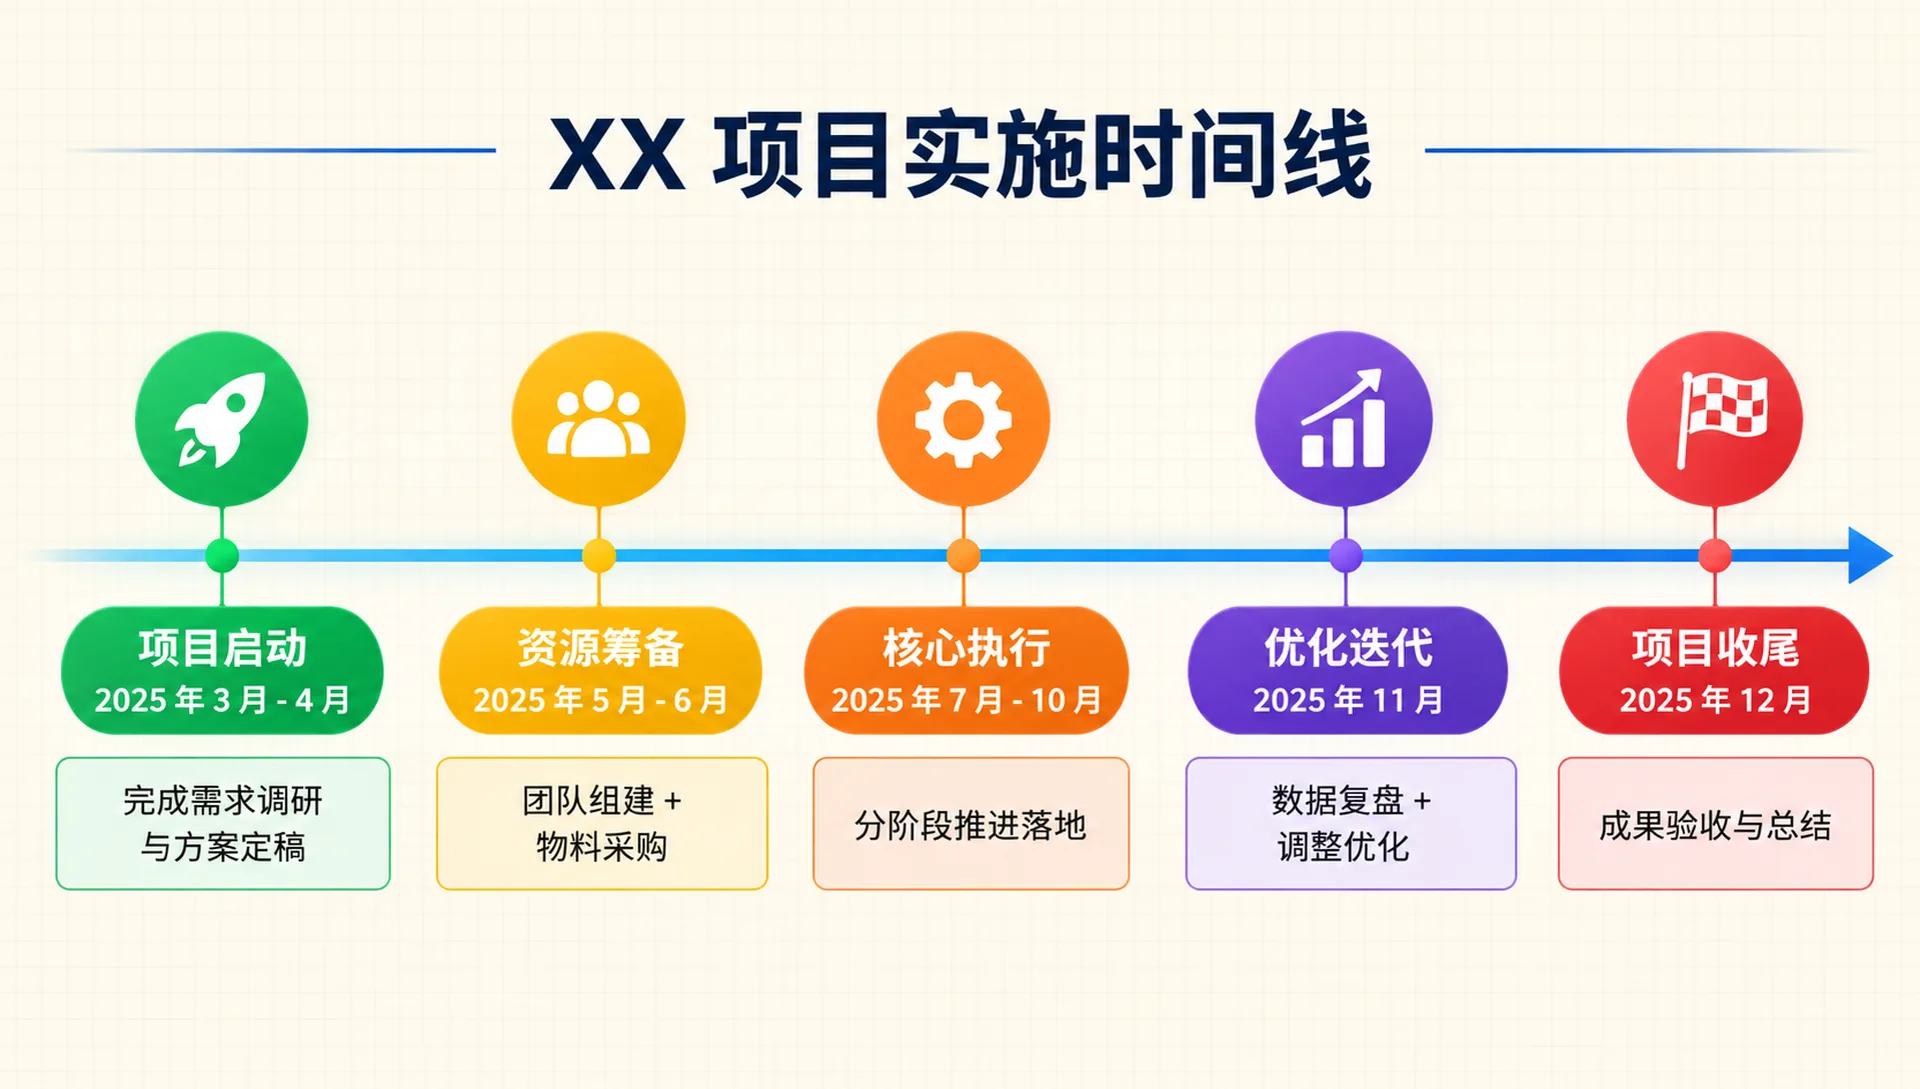
This capability shows up on three levels. The first is relationship decomposition: from natural-language descriptions it quickly decomposes cause-effect, hierarchy, parallel, process, and other relationships, cleanly distinguishing the core features of each logic type so the chart reproduces the semantics accurately; for complex instructions with conditional judgments, it also sorts out branch logic precisely, clarifying the boundaries and connections of each path.
The second level is hierarchy building: it automatically maps the primary and secondary relationships in the information, builds a clear hierarchy, and uses differentiated visual elements to mark priority levels, so the chart highlights the core elements without losing key details. It also handles multi-dimensional, cross-cutting complex logic—in the case pair below, the left image is a complex relationship diagram produced by mapping relationships, and the right is a three-panel “Emperor’s New Clothes” logic comic generated through logical reasoning, with the story’s “con trick—vanity—exposure” chain fully intact:
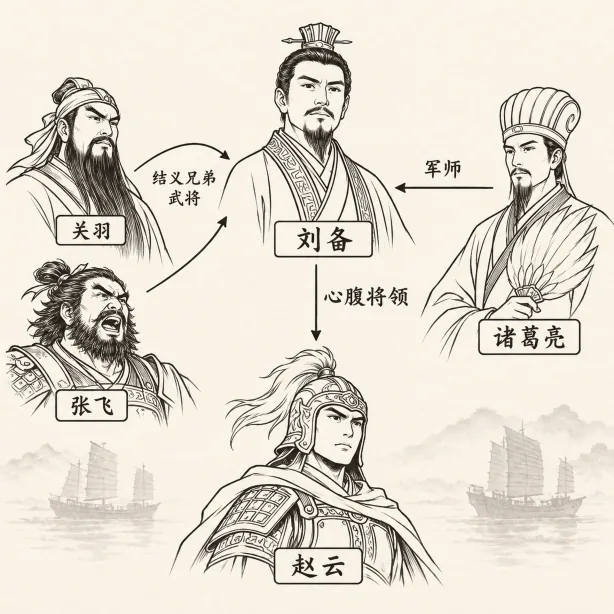
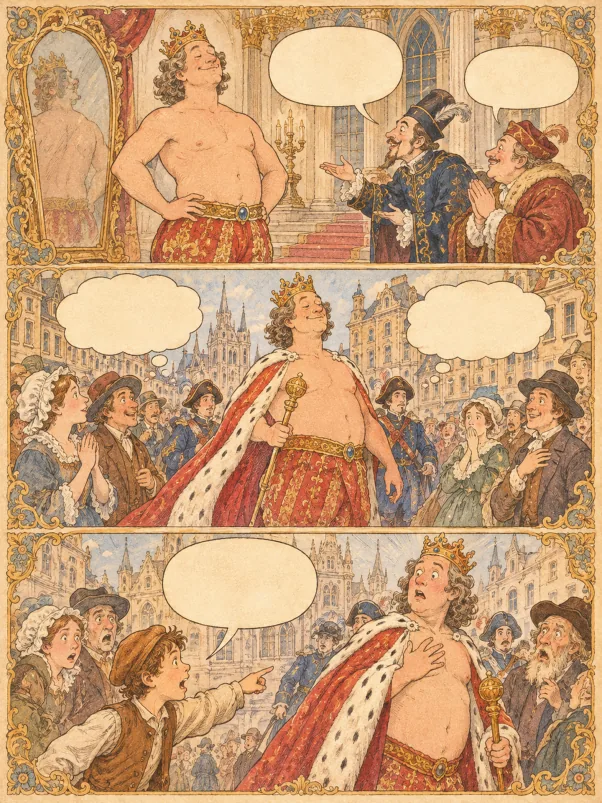
Fig. 1-1 Complex relationship diagram and logic comic: logic understanding made visible
The third level is industry adaptation: it aligns deeply with the professional logic standards of different fields and follows each industry’s common chart presentation conventions, so charts are not only logically coherent but match industry expectations, ready for specific domains without extra adjustment.
Capability 2: Powerful Text Handling
Text is a key carrier of the information in a chart, and the most common failure point of traditional AI tools is blurry, jumbled text. Puyo AI builds text handling into chart composition: chart titles, data labels, and annotation text all keep their readability, achieving harmony between text and visual elements.
It does three things right. First, distillation: from long text instructions it quickly picks the key information and trims the redundancy, condensing complex descriptions into concise, readable chart text that stays complete at its core; second, style control: it tunes text style precisely to the chart’s overall look—size, color, spacing—so titles stand out and annotations stay clear without clashing; third, placement planning: by chart type and information density it plans where text sits, letting text and graphic elements complement each other.
Multilingual scenarios are easy too—Chinese semantic labels and English technical terms both keep accurate expression and clean layout; in the case below, Chinese annotations and English terms share one chart, each doing its own job:
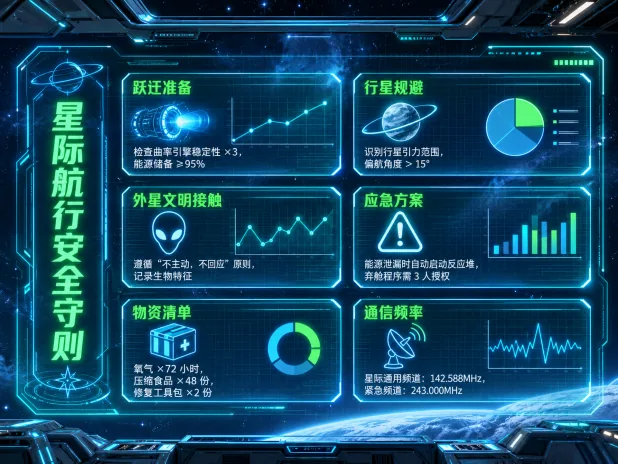
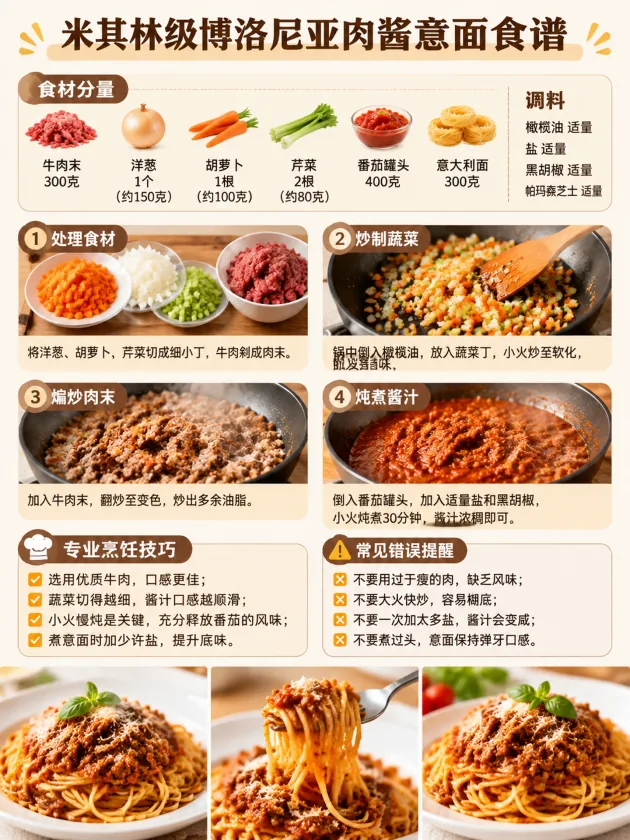
Fig. 1-2 Crisp, standard chart text: neither Chinese nor English labels blur
Capability 3: Rich Ways of Presenting Information
The third advantage is the chart-type matrix: Puyo AI covers the basic, combined, and professional statistical chart families, meeting the visualization needs of personal daily use, business office work, academic research, industrial monitoring, and more.
For basic charts, it guarantees standard compliance and automatically adds the key visual elements each chart type needs, improving information capacity—in the two basic-chart examples below, axes, legends, and data labels are all present:
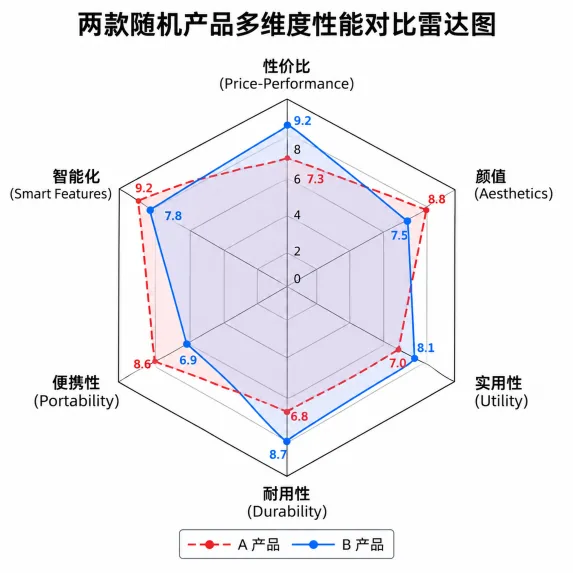
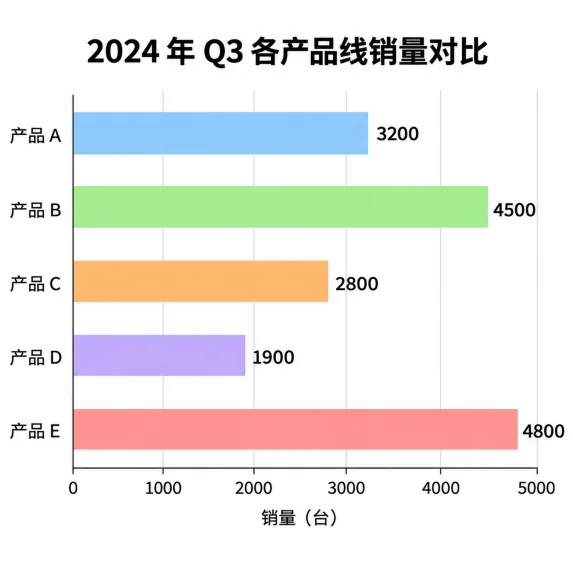
Fig. 1-3 Standard compliance and detail optimization in basic charts
For combined and complex charts, it flexibly mixes chart types to present multi-dimensional information in sync; multi-layer overlays and multi-element fusion clearly present complex logic and system architecture. For personalization and scenario adaptation, it offers multiple preset themes with adjustable visual styles; it also carries professional visual controls—camera angle, lighting effects, depth of field, and color grading are all adjustable, producing high-resolution ultra-HD charts fit for digital display and professional printing alike; the multi-image fusion feature can also blend reference-image elements, visualizing complex creative scenes.
Closing: How Capabilities Become Finished Charts
Each of the three capabilities governs one stretch: logic understanding governs “are the relationships right”, text handling governs “is it readable”, and information presentation governs “does it fit the scenario”. Knowing this gives you a firm grip when writing prompts—state the logical relationships clearly, list the text labels you need in advance, and name the chart type by scenario, and your hit rate rises sharply.
Compress this thinking into a fill-in-the-blank chart prompt skeleton, one copy per language—write all five sections and you have a solid chart prompt:
Generate a [chart type]: X-axis is [dimension], Y-axis is [dimension and unit], data: [values one by one]; line/bars/sectors in [colors and texture], background [base color + grid], bold title [chart name], legend at [position], [minimalist / business / lively] style, high definition, no watermark
Skeleton version of a chart prompt: name the chart type up front, write out the data in full in the middle, lock the styling at the end, then paste it into the generation page.
Capabilities are background knowledge; getting started only takes a fixed workflow. In the next guide, the complete case of “one long document becomes one chart” breaks the three steps of organize content → pick chart type → generate and refine for you—follow along and you’re up and running: Turning a Document into a Chart: A Three-Step Hands-On Tutorial.
FAQFrequently Asked Questions
The questions beginners ask most about this guide
Which model does Puyo AI use for charting?
Driven by Gemini 3 Pro. Its unique thinking mode performs layered reasoning on complex prompts: it first maps the inherent connections between pieces of information, then plans the chart’s logic, eliminating cluttered charts and misaligned relationships at the root.
AI-generated charts always have blurry, garbled text—is Puyo AI the same?
No. Text handling is precisely its strength: chart titles, data labels, and annotation text all stay crisp and readable, and text size, color, and spacing can be adjusted to match the chart’s style, with mixed Chinese-English layouts rendered cleanly too.
Can it draw complex flows and conditional logic correctly?
Yes. For complex instructions containing conditional judgments, it sorts out branch logic precisely and clarifies the boundaries and connections between different logic paths; multi-dimensional, cross-cutting complex logic is also within its grasp—not just simple linear relationships.
What types of charts can it make?
Full coverage in three families: basic charts (bar, line, pie and more), combined charts (multiple chart types complementing one another), and complex charts (multi-layer overlays, multi-element fusion)—adapting to personal, office, academic, and industrial scenarios.
Can the generated charts be used in formal reports and print?
Yes. It supports adjusting camera angle, lighting effects, depth of field, color grading and other parameters, producing high-resolution ultra-HD charts that satisfy both digital display and professional printing needs.
Does it understand different industries’ charting standards?
Yes. It aligns deeply with the professional logic standards of different fields and follows each industry’s common chart presentation conventions, so generated charts match industry expectations and can be used as-is without extra adjustment.
About the Author: Julia, Veteran AI Image Creator
Julia has long used AI image tools for avatars, illustrations, productivity diagrams, and character design, and has coached large numbers of complete beginners. Every case, prompt, parameter, and screenshot in this article comes from real generation records on the Puyo AI platform—not theoretical speculation, not stitched-together stock. This is the overview of the chart-making series; the next guide jumps straight into the three-step “document to chart” workflow.
The content is adapted and polished from the original material “From Novice to AI Art Pro | Complete Hands-On Tutorial Collection”, with all original prompts and figures preserved. Source: https://www.puyoai.com.
Capabilities Understood—Time to Try It
Open the Puyo AI website and see whether one sentence can turn your idea into a chart.
Results are affected by model version and randomness—the same prompt will vary slightly each time it runs; run it a couple of rounds before drawing conclusions.