
AI Abstract Concept Visualization:Math DerivationAnd Physics Principle Diagrams
The core of an abstract-concept-visualization prompt is “step logic + formula annotation”: math needs the step-by-step breakdown and the annotation for each step, physics needs the law structure, module zones and core relationships — add one line about “adapting to grade level and scenario” and you get both rigor and clarity.
What You’ll Take Away
Why Start Courseware Images with Abstract Concepts
In traditional teaching, abstract knowledge is hard to explain, learning materials are dull and memory retention is low — three mountains weighing on teachers and students alike — while visual teaching makes knowledge intuitive and easy to grasp. Puyo AI, as a practical teaching-visualization tool, turns all kinds of knowledge into clear, easy-to-understand teaching images: making the abstract concrete and complex logic visible. The toughest and most valuable part of this section is abstract concept visualization: the rigorous logic chain of math derivations and the abstract laws of physics principles.
Math Hands-On: The Distributive-Property Apple Diagram
For math derivation visualization, the prompt must spell out the step-by-step logic and formula annotations, specify the visual type, and mark the teaching scenario and grade level. Let’s walk through a classic primary-school math case — the distributive property. Step 1: open Puyo AI’s image generation interface, click the “Model” button, set the image generation model to “Puyo AI Standard”, and enter the prompt in the input box:
Childlike simple drawing style, pure white background. On the left: 3 sets of “2 red apples + 1 yellow apple”, with cartoon text “3×(2+1)” above. On the right, split into two parts: 3 sets of 2 red apples and 3 sets of 1 yellow apple, labeled “3×2” and “3×1” respectively. Orange arrows connect the left and right sides in the middle, with the note “=3×2+3×1” next to the arrows. The apples are round and cute with bright red and yellow colors. Labels are bold and eye-catching. The derivation is straightforward and easy to understand.
How to: set the model to “Puyo AI Standard”, enter the prompt, set the ratio to 16:9, the resolution to 2K, and the number of images to 1, then click “Create”.
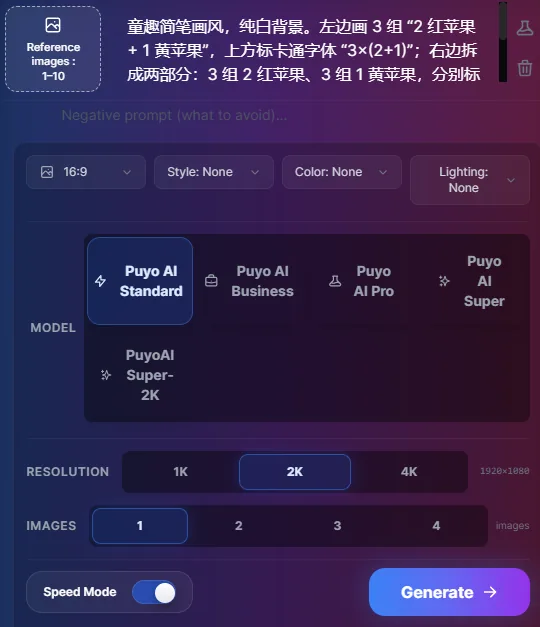
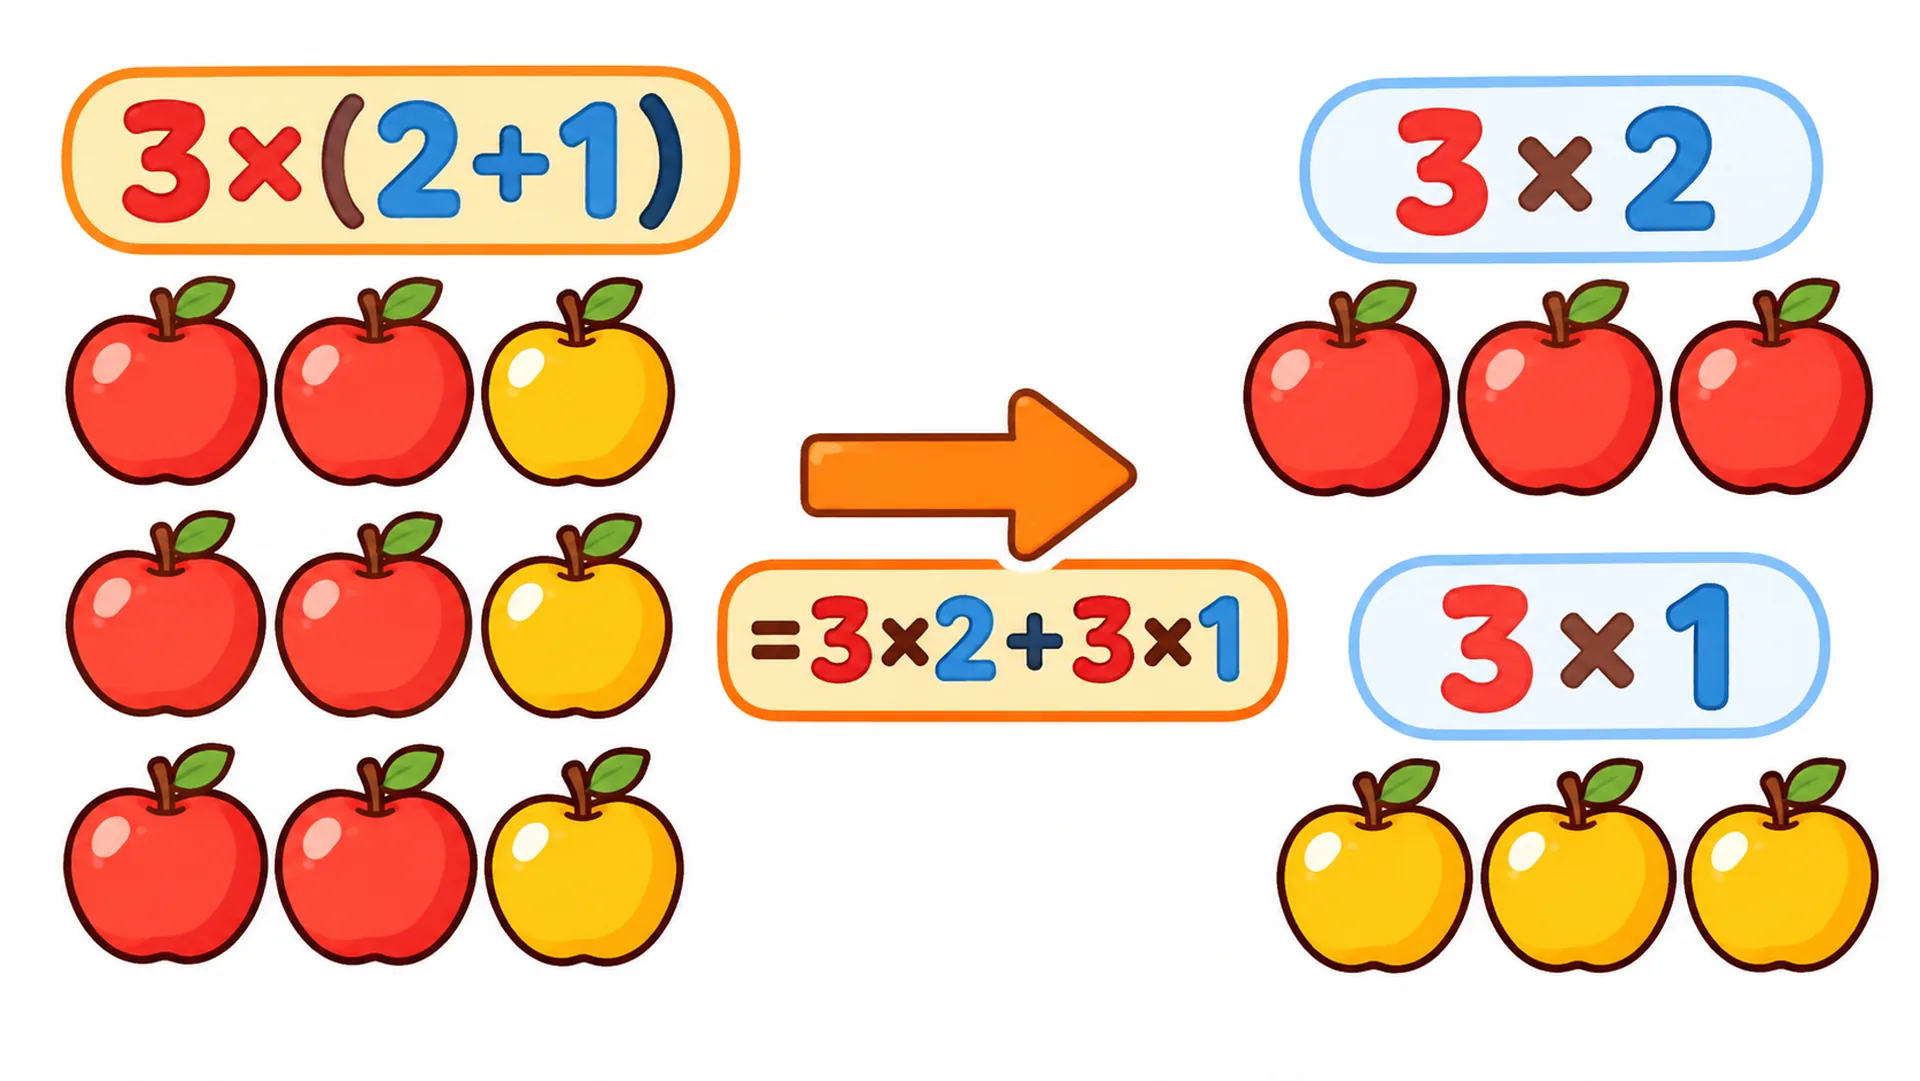
Figure 1-1: Apple Diagram — Left/Right Columns + Arrow Connections + Item-by-Item Annotations
This prompt’s structure is “the derivation itself”: the original expression in the left column, the expanded expression in the right, and arrows in the middle marking the equality — write the order you’d use on the blackboard into the prompt verbatim, and what AI draws is a slide ready to project.
Physics Hands-On: A Bernoulli’s Principle Science Illustration
Physics principle visualization must spell out the law structure and core relationships. Bernoulli’s principle spans two applications — “fluid pressure” and “wing lift” — and is best shown with a modular structure. Step 1: set the image generation model to “Puyo AI Standard” and enter the prompt in the input box:
Vintage hand-drawn science illustration on yellowed beige paper texture, soft lines with hand-drawn brush strokes, low-saturation warm color palette. The artwork is divided into two sections: ① Upper part: Venturi tube setup, wide sections at both ends and a narrow throat in the middle. The tube is filled with pale translucent blue water flow. Blue arrows indicate flow velocity (arrows are denser in the narrow throat). Two red pressure gauges (high needle readings) are placed on the wide sections; two light-colored pressure gauges (low needle readings) are on the narrow throat. Handwritten labels beside: “Wide section (low flow speed, high pressure)” and “Narrow section (high flow speed, low pressure)”. ② Lower part: Airfoil cross-section (filled with gray hatching). Blue arrows above marked “Faster flow speed, lower pressure on top”, red arrows below marked “Slower flow speed, higher pressure at bottom”, and an upward red arrow marked “Lift”. The Bernoulli equation “P+½ρv²+ρgh = constant” is handwritten at the bottom. All information is clearly arranged, with the texture of a vintage science poster.
How to: set the model to “Puyo AI Standard”, enter the prompt, set the ratio to 9:16, the resolution to 2K, and the number of images to 1, then click “Create”.
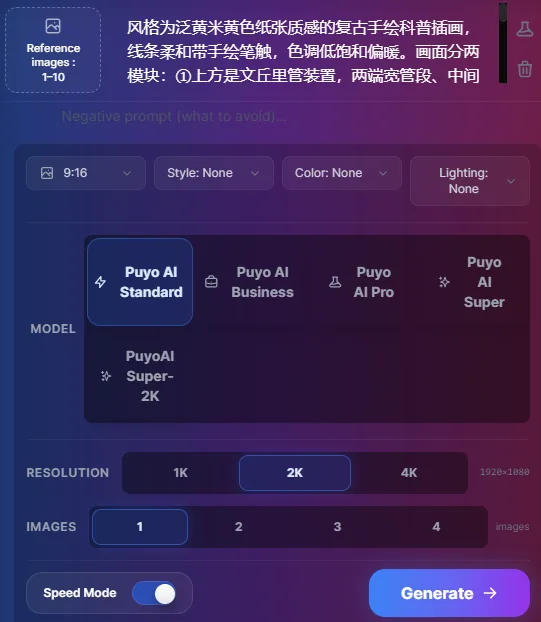
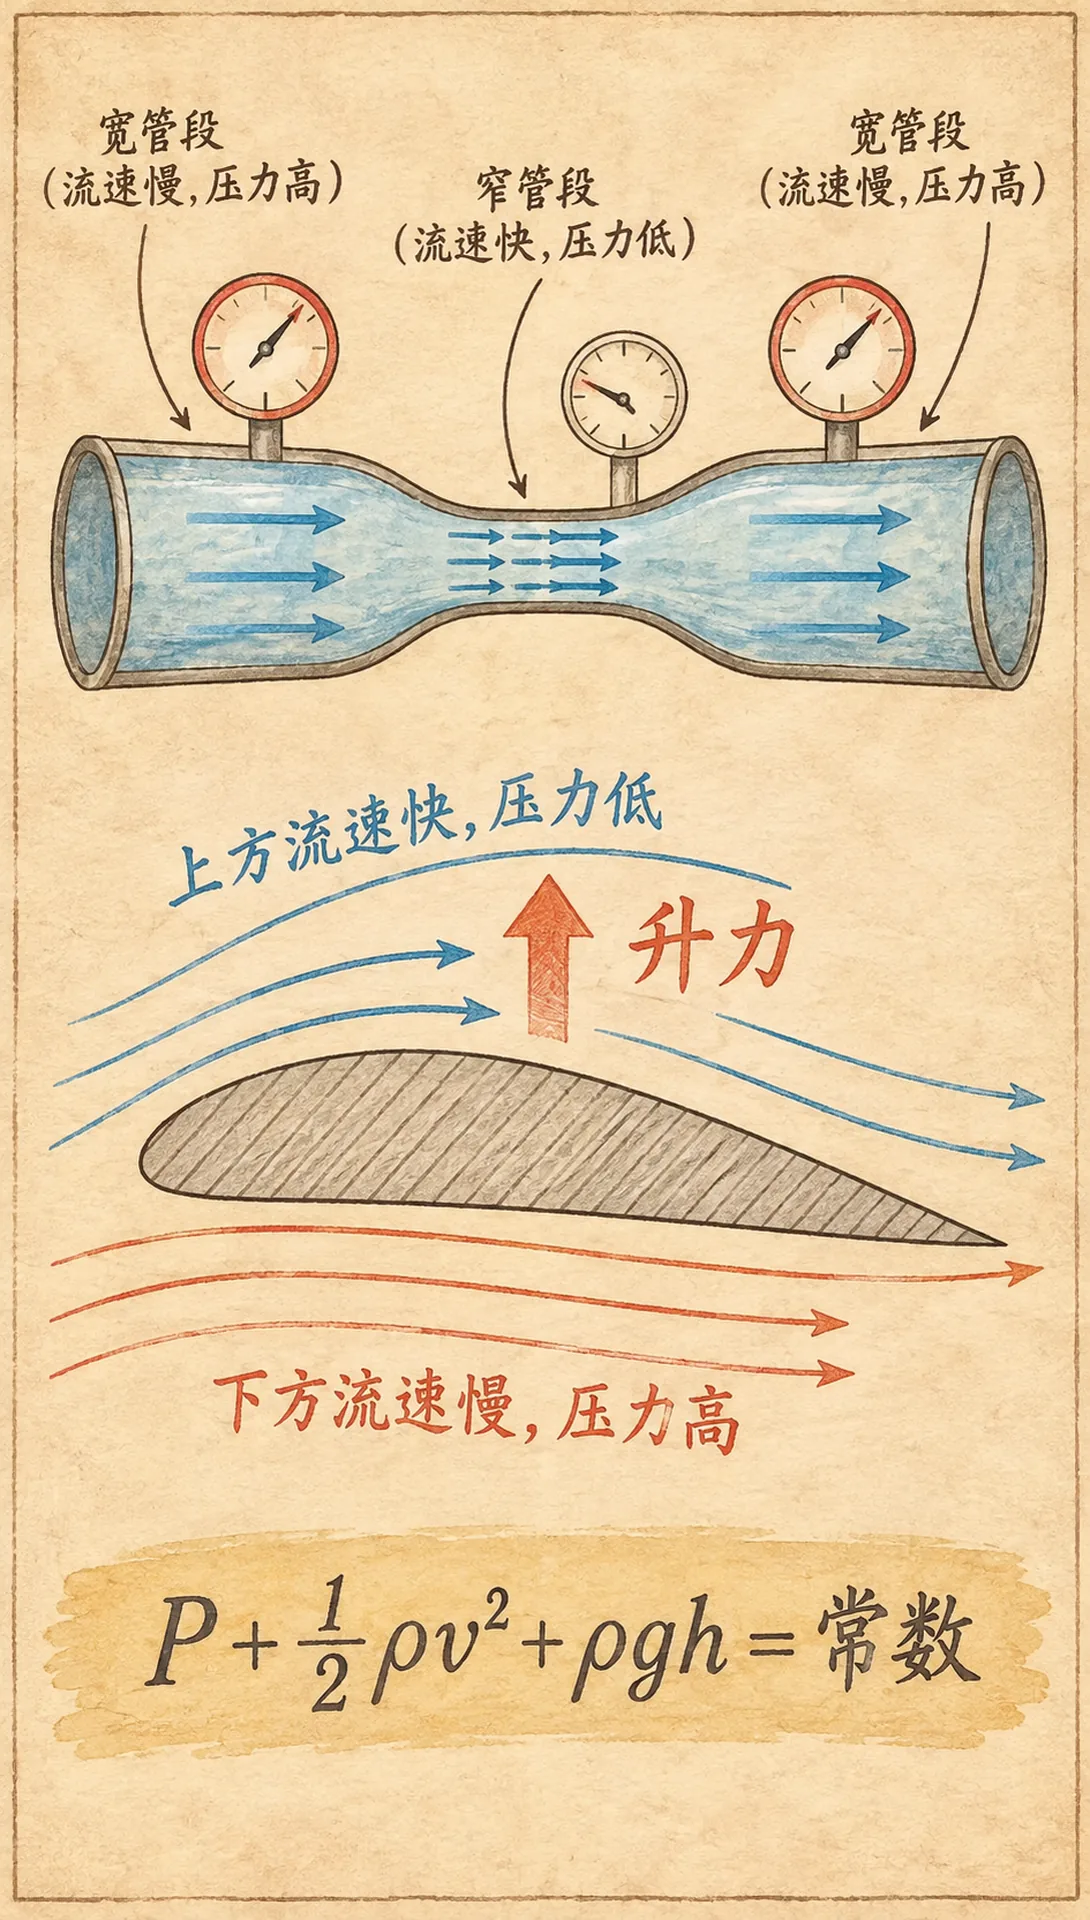
Figure 1-2: Bernoulli’s Principle — Dual-Module Zones + Pressure-Gauge States + Formula Wrap-Up
Look at the three “fail-safe” designs in this example: module numbers (①②) keep AI from mixing up the two devices; the pressure-gauge needle states (red for high, light for low) turn an abstract pressure difference into a visible gauge reading; and the formula at the bottom ties the whole thing together — that’s where a physics diagram’s sense of rigor comes from.
Prompt-Writing Recap
After two hands-ons, the writing method for abstract concept visualization boils down to three sentences:Step 1: Break Down the StepsBefore you start writing, break the internal logic of the derivation or principle into clearly ordered modules;Step 2: Write the AnnotationsWithin each module, spell out the text, formulas and arrow meanings item by item, quoting them verbatim;Step 3: Set the StyleChoose a childlike line drawing, a vintage hand-drawn poster or a clean tech style based on the students’ grade level and teaching scenario. The next article extends this method to science diagrams: molecular structures, landforms and biological processes.
FAQFrequently Asked Questions
The questions beginners ask most about this guide
Can AI Guarantee a Math Derivation Diagram Is Error-Free?
Yes, as Long as the Steps Are Written ClearlyWrite the derivation logic into the prompt in the order of “original expression on the left, expanded expression on the right, arrows connecting in the middle”, and specify the annotation text for each expression — AI will arrange everything strictly by your logic: you control the logic, AI handles the rendering.
How Do You Choose Illustration Styles for Lower Grades vs. Middle School?
Follow Students’ Cognitive TraitsFor primary school, simplify character actions and scene elements and use a cartoon style for fun; for middle school, restore the causal logic and deeper meaning of the knowledge and use a realistic or rigorous style for credibility — the style itself is a form of grade-level differentiation.
How Do You Keep a Physics Diagram from Becoming “Art”?
Modular DescriptionLike the Bernoulli example, split the picture into two modules — “Venturi tube on top, wing cross-section below” — and spell out the apparatus, arrows, pressure gauges and annotations in each module item by item, so AI won’t improvise it into a free-form illustration.
Can You Put Two Knowledge Points in One Image?
Yes, with a Modular StructureIn the example, the Venturi tube and wing lift are two applications of Bernoulli’s principle, numbered “①②” and split into upper and lower zones, with the formula placed at the bottom to tie things together — modularization keeps multiple knowledge points from clashing.
Can AI Draw the Symbols in a Formula Correctly?
Mainstream Formulas Are No ProblemStandard formulas like “P+½ρv²+ρgh = constant” are written verbatim in the prompt inside quotation marks with a note to “render in handwriting”, and AI can reproduce them accurately; check uncommon symbols once after generation.
What Ratio Works Best for Courseware?
Use 16:9 for Projected Slides, 9:16/4:3 for Printed or Vertical HandoutsThe math example uses 16:9 to fill a PPT slide exactly, the physics example uses 9:16 for vertical display, and the resolution is 2K across the board to keep details sharp.
About the Author: Julia, Veteran AI Image Creator
I have long used AI image generation tools for courseware diagrams, teaching cards and memory aids, and have guided many complete beginners. Every case, prompt, setting and screenshot in this article comes from real generation records on the Puyo AI platform — not theory, not stitched-together stock material. After abstract concepts, the next article moves into science diagram hands-ons for molecular structures, landforms and biological processes.
Content adapted and polished from the original material “From Novice to AI Art Pro | Complete Hands-On Tutorial Collection”, with all original prompts and figures preserved. Source: https://www.puyoai.com。
Draw Out Your Knowledge Point
Open the Puyo AI website, turn the most abstract knowledge point in your lesson into a prompt, and generate an image students can actually understand.
Results are affected by model version and randomness—the same prompt will vary slightly each time it runs; run it a couple of rounds before drawing conclusions.