AI Knowledge-Note Concept Maps and Project Plan Diagrams: Two Efficiency Prompt Templates
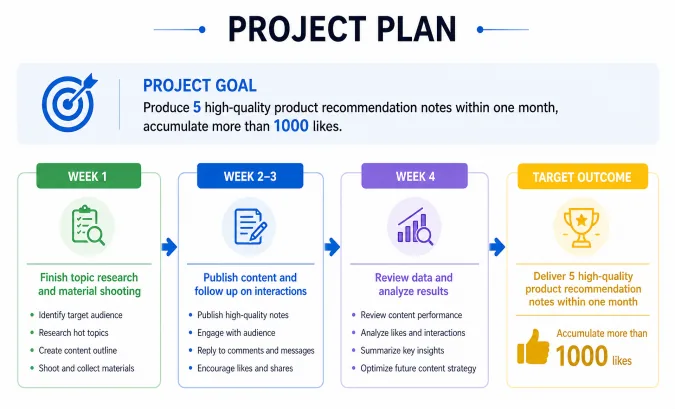
The knowledge-note concept map uses the “Preview → Focused Reading → Review & Output → Regular Review” four-step method as its subject, ratio 3:4, resolution 2K; the project plan diagram is built on “goal + four weekly time nodes”, ratio 16:9, resolution 2K. Both prompts are copy-ready verbatim, generated directly with the Puyo AI Standard model.
What You Will Take Away From This Guide
Knowledge-Note Concept Map: Drawing a Reading Method into One Image
The knowledge-note concept map’s value lies in fixing the method in place: organize the knowledge logic, build the cognitive framework, pin the image to your desk or set it as wallpaper—every glance is a reminder. The template below writes a complete reading methodology (preview → focused reading → review → regular review) directly into the image structure:
Knowledge note concept diagram Preview: Check the title, table of contents and abstract first, quickly build the content framework and clarify reading goals. Focused Reading: Mark core viewpoints and key data, sort out logical connections with mind maps. Review & Output: Summarize the core in 3 sentences after reading, or try retelling it to others. Regular Review: Review according to the Ebbinghaus forgetting curve to boost memory retention. Key point: Read with questions in mind, avoid word-for-word intensive reading, and focus on information valuable to you.
Click “Copy Prompt” at the top right of the card to copy the whole thing, then paste it straight into the generation interface.
The operation takes four steps: open the Puyo AI image generation page, click “Model” and set it to Puyo AI Standard; paste the prompt into the input box; set ratio 3:4, resolution 2K, count 1 image in order; click “Create” to generate:
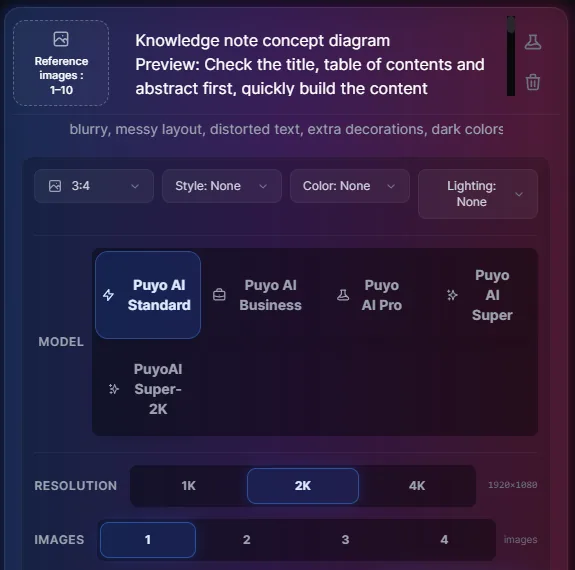
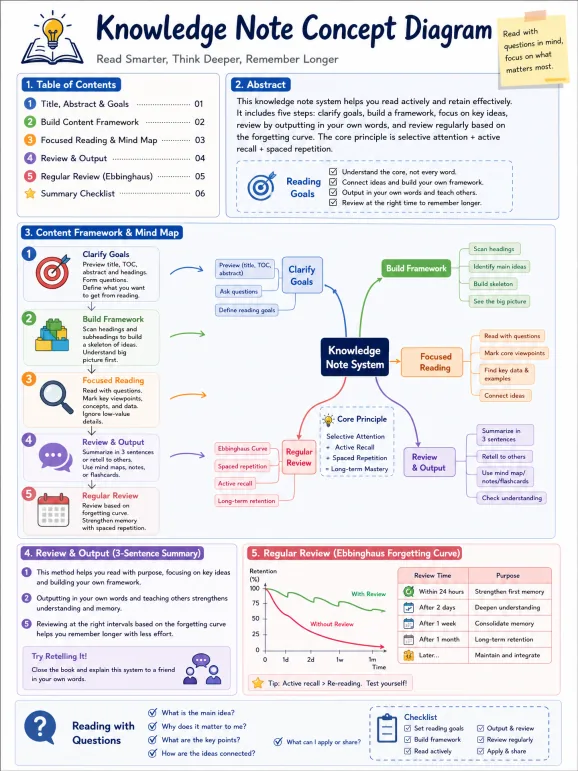
Fig 1-19 Knowledge-note concept map: from input to image
One lesson for writing chart prompts like this: the steps themselves are the image structure. Four verb-led headings—”Preview / Focused Reading / Review / Regular Review”—get laid out into clean zones automatically; hang 2-3 key points under each step and the information hierarchy reads at a glance.
Project Plan Diagram: Pinning a Four-Week Plan in One Image
The core of a project plan diagram is a quantifiable goal + clear time nodes. Write the goal as “publish 5 quality product-recommendation notes and accumulate 1000+ likes” rather than “grow the account well”; make the nodes week-precise and the image holds up:
Simple project plan diagram Project goal: Produce 5 high-quality product recommendation notes within one month, accumulate more than 1000 likes. Timeline: Week 1: Finish topic research and material shooting Week 2–3: Publish content and follow up on interactions Week 4: Review data and analyze results
Swap the goal and nodes for your own project; keep the rest of the structure unchanged.
Parameters differ from the previous example: choose 16:9 landscape so the timeline spreads horizontally and breathes; resolution 2K, count 1 image, click “Create”:
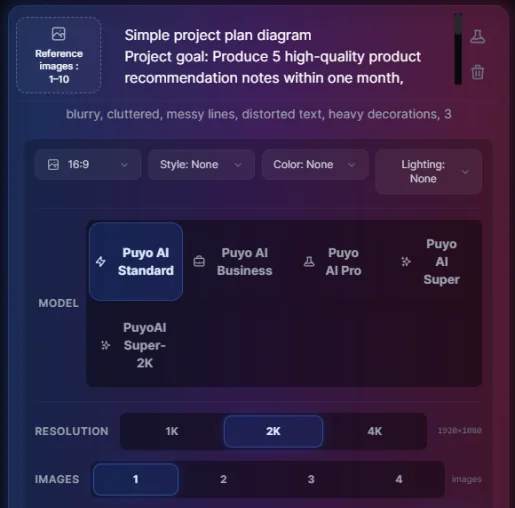
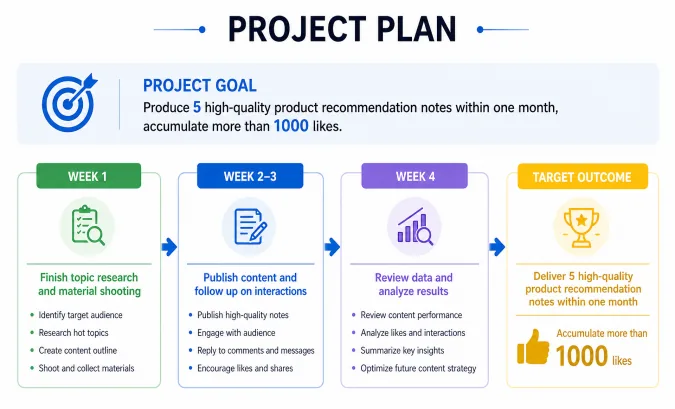
Fig 1-20 Project plan diagram: from input to image
Usage Advice and Next Steps
Chart-type prompts must carry negative exclusions (“blur, clutter, text distortion”)—the biggest difference between charts and illustrations: a blurry illustration counts as style, a blurry chart is dead. Fix text errors with the instruction iteration method from Part 3, one item per round.
The social platform image templates are in Part 4, Instagram-Style Minimalist Avatars and Xiaohongshu Check-In Illustration Prompts; when study fatigue hits and you want something lighter, open Part 6, Dream Recreation and Game Character Design Prompts.
FAQFrequently Asked Questions
The questions beginners ask most about this guide
Is the text in AI-generated diagrams accurate?
Mostly accurate but needs proofreading. Diagram prompts are information-dense; short sentences and numbered items have the highest recognition. After generation, check the text item by item and fix any typos by revising the corresponding entry with instruction iteration.
How is a concept map different from a mind map?
Concept maps emphasize relationships; mind maps emphasize divergence. The templates here organize information as “steps + key points”, fitting methodology and process content; for pure brainstorming divergence, a mind-map template fits better.
Can I generate my own course notes?
Yes. Replace the four steps “Preview / Focused Reading / Review / Regular Review” with your notes’ chapter structure, keeping 2-3 key points per step—the clearer the structure, the tidier the output.
What ratio for the knowledge-note concept map?
3:4 portrait. It reads more completely on phones and slots into note apps easily; for screen-projected reports like the project plan diagram, 16:9 landscape fits better.
What if one image cannot hold all the content?
Trim the points first. Keep the 2-3 most critical pieces of information per step and split the rest into a second image; the fuller the information, the smaller the text and the lower the recognition.
Where is a 16:9 image best used?
Landscape scenarios: weekly meetings, kanban walls, and secondary official-account header images all work; for mobile sharing or printing as cards, switch to 3:4 portrait.
About the Author: Julia, Veteran AI Image Creator
Julia has long used AI image tools for avatars, illustrations, productivity diagrams, and character design, and has coached large numbers of complete beginners. Every case, prompt, parameter, and screenshot in this article comes from real generation records on the Puyo AI platform—not theoretical speculation, not stitched-together stock. This is Part 5 of the series (work & study practice); see Part 1 for the formula basics and Part 3 for refinement methods.
The content is adapted and polished from the original material “From Novice to AI Art Pro | Complete Hands-On Tutorial Collection”, with all original prompts and figures preserved. Source: https://www.puyoai.com.
Hand Your Plan to the AI to Draw
Open the Puyo AI website, apply this guide’s templates to generate your own concept map and plan diagram, and pin them above your desk to see every day.
Results are affected by model version and randomness—the same prompt will vary slightly each time it runs; run it a couple of rounds before drawing conclusions.