Featured
-
AI Historical Scene Reconstruction and Literary Imagery:The Uprising MomentAnd a Peach Blossom Spring Hands-On
Words in history textbooks always feel one step removed, and the mood of literary works is even more “beyond words”. This article uses two hands-ons — the Dazexiang Uprising and The Peach Blossom Spring — to make the visualization of humanities content work end to end: faithful to historical facts and the text, yet artistically expressive.
-
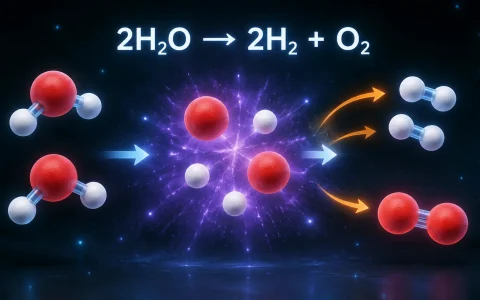
How to Generate AI Science Diagrams:Molecules and LandformsAnd a Biological Process Hands-On
Science diagrams are a must in science classes: the spatial arrangement of molecules, the evolutionary texture of landforms and the dynamic mechanisms of biology can only be explained clearly with images. This article’s three hands-ons span chemistry, geography and biology — learn the staged-presentation diagram formula in one go.
-
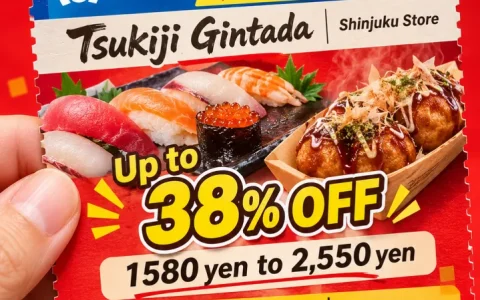
How to Make Promo Coupons and Character Breakdown Sheets: AI Everyday-Design Prompt Templates
Opening a store means needing a promo coupon; drawing characters means needing a design breakdown—these non-standard image requests mean high design-agency costs and fiddly DIY layout. Puyo AI gets it done with two prompts, and both templates in this guide are copy-ready word for word.
-
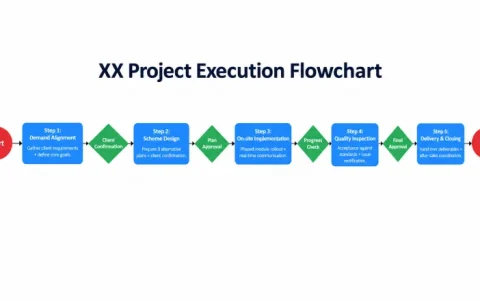
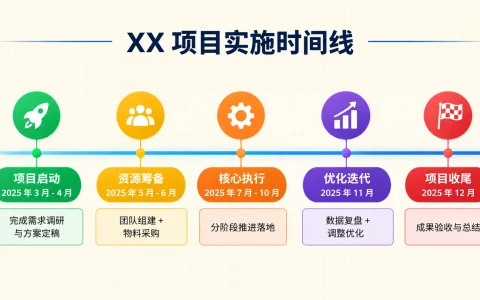
How to Generate Project Timeline Charts and Flowcharts: AI Project Visualization Prompt Templates
The scariest part of a project report is failing to explain “what comes first, what comes next, and what hands off to what”. Timeline charts handle sequencing and milestones, flowcharts handle task flow and handoffs—this guide’s two templates are copy-ready, turning your project steps into one image everyone understands.
-
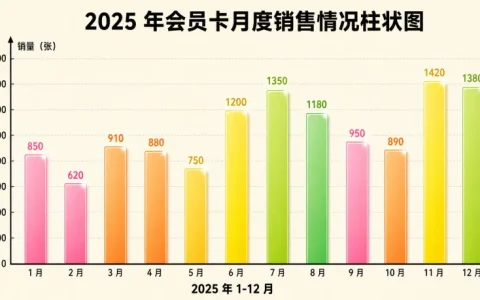
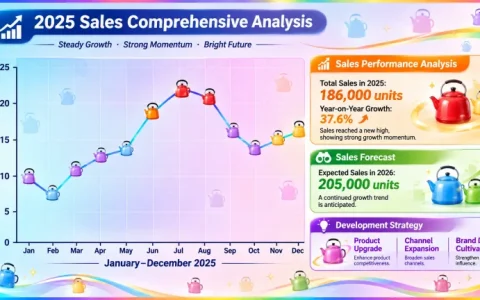
How to Generate Bar Charts and Pie Charts with AI: Sales Data Visualization Prompt Templates
Comparing values and showing shares are the two most common charting needs at work. This guide gives you two copy-ready prompt templates—bar charts for size comparisons and donut pie charts for share breakdowns—so you can swap in your own data and get a chart right away.
-
How Does a Document Become a Chart: A Three-Step Hands-On Tutorial (with a Line Chart Case)
Reports, notes, and data sheets piling up, and you want them as charts anyone can read at a glance? This workflow takes only three steps, each with ready-made tools and prompt templates—follow along and you can turn any document into a chart.
-
Why Puyo AI Is Especially Good at Charts: Three Core Capabilities Explained
Charts are a powerful way to make complex information intuitive, but ordinary users usually get stuck on “tangled logic, misaligned text, wrong chart type”. This guide first breaks down Puyo AI’s three core charting capabilities—understand why it’s strong, and the hands-on guides that follow will have a clear direction.
-
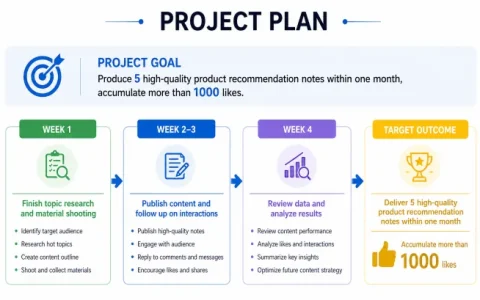
AI Knowledge-Note Concept Maps and Project Plan Diagrams: Two Efficiency Prompt Templates
Concept maps help you organize knowledge logic; plan diagrams pin down task nodes — these two chart types are the efficiency essentials of work and study. This guide hands you two field-tested prompts as-is: paste into Puyo AI and turn methodology into one image.