
How Does a Document Become a Chart: A Three-Step Hands-On Tutorial (with a Line Chart Case)
Document to chart takes only three steps: first use Doubao/DeepSeek to condense the document into useful text and data, then pick the right chart type for the scenario, and finally apply the “clear goal + core data + chart type + style spec + refinement instructions” formula to let Puyo AI generate the chart. If it looks plain, edit the prompt to add text modules—a simple chart becomes a composite analysis chart in seconds.
What You’ll Take Away from This Guide
Step 1: Organize the Document into Useful Content
The first task is organizing the text to get the prompt you’ll feed Puyo AI to generate the image. Image tools aren’t good at digesting a long document directly, so start by subtracting with a text AI—popular options like Doubao and DeepSeek can condense the document into useful content.
Doubao is the example here, used to organize the uploaded document into text and data. Step one: open the Doubao page and click the “+” button to upload a file or image:
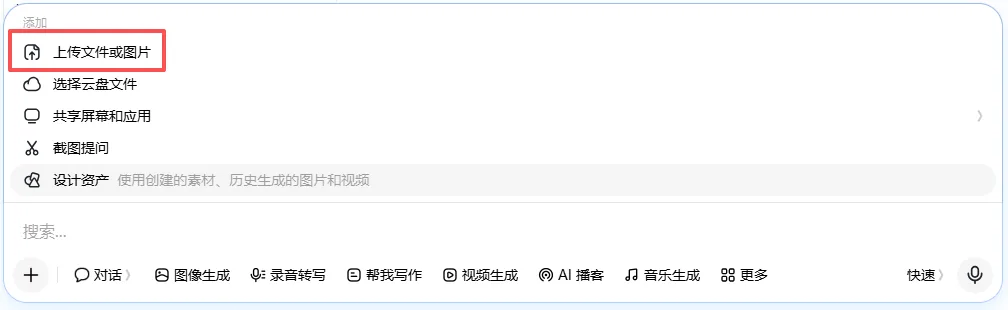
Fig. 1-4 Uploading the document
Step two: type your request into the input box and click send to get the answer—have it organize the document into structured text and data; this output is the raw material for the next step:

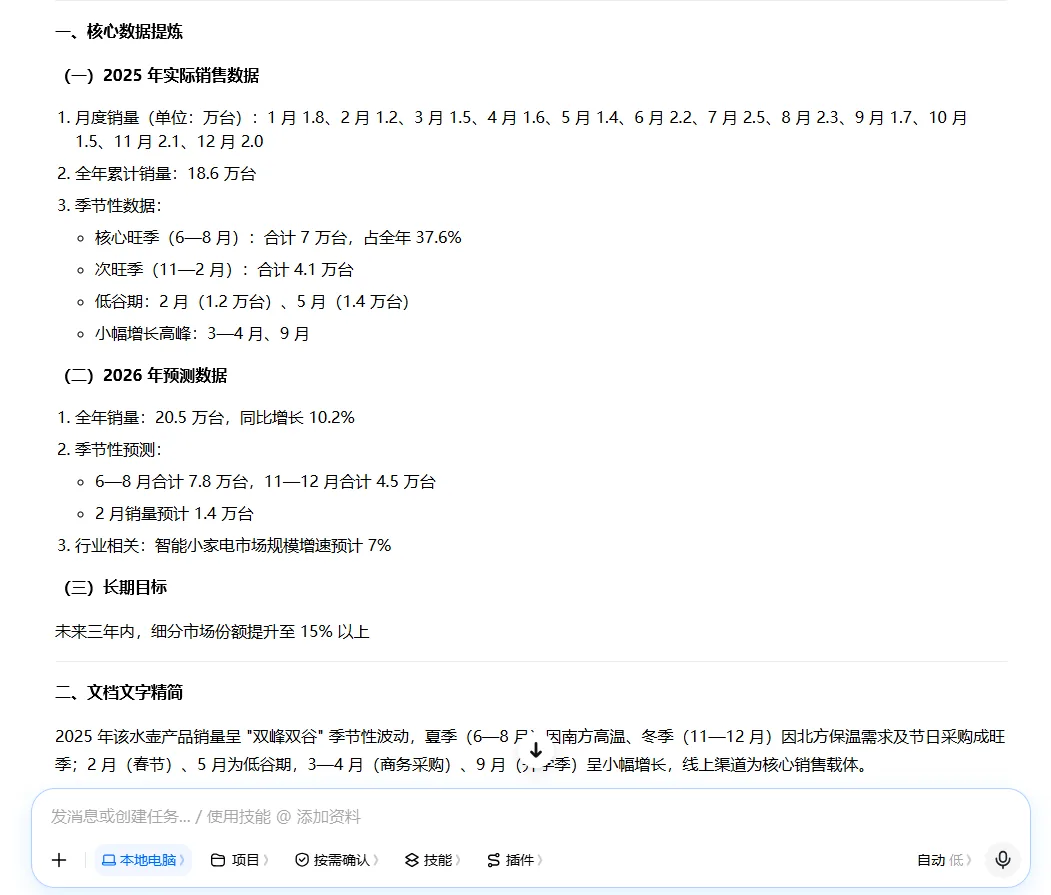
Fig. 1-5 Entering the request and getting the organized result
Step 2: Choose the Right Chart Type
Once the document has become text and data, you can turn it into a chart. Different data suits different charts, and you must pick the best fit for the scenario and need. Trends get line charts, size comparisons get bars, shares get pies, flows get flowcharts—before choosing, check the pros and cons of the major chart types; the table below works as a quick-reference sheet:
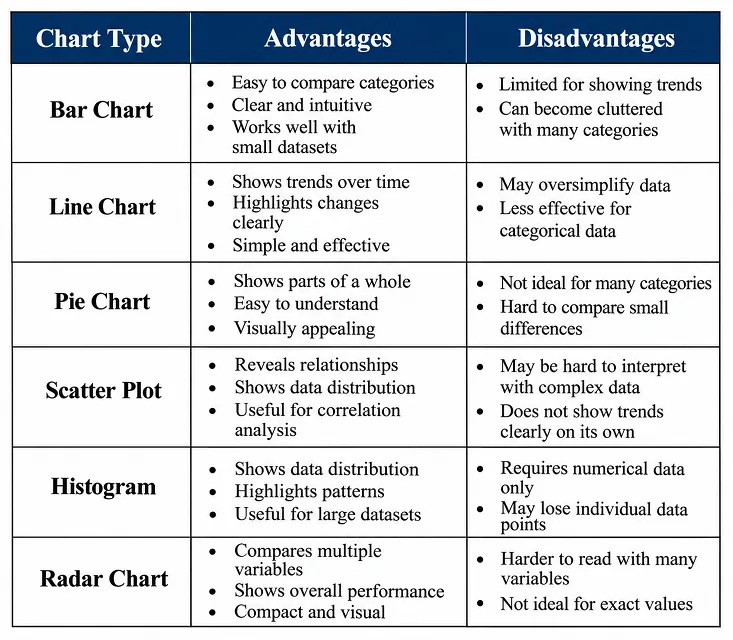
Table 1-1 Pros and cons of the major chart types
For example, to chart kettle sales, the core is showing the trend of full-year sales, so a line chart is the best choice.
Step 3: Generate the Chart and Refine It
With the prompt ready and the chart type chosen, let Puyo AI generate the line chart. Many people don’t know how to convert organized content into a chart—just apply this formula: clear goal + core data + chart type + style spec + refinement instructions. Four techniques while writing:
Name the chart type: state the chart name up front, like “generate a bar chart” or “make a pie chart”, so the tool doesn’t mix up the visual form; describe the data precisely: clearly state the data dimensions (categories, comparison items) and value relationships (magnitude, share, trend)—don’t shy away from concrete numbers, exact proportions make exact charts; specify the visual elements: constrain the style (minimalist, business, ins-style), the palette (monochrome, contrasting colors), and the layout (horizontal, vertical, ring, sector); add information labels: mark the title, axis notes, legend position, and data-label display rules so the chart’s information is complete.
Below is the complete prompt for the kettle monthly-sales line chart, with the data section ready to swap for your own:
Line chart of monthly sales of kettle products in 2025. X-axis: January–December 2025. Y-axis: Sales Volume (10,000 units). Data: Jan 1.8, Feb 1.2, Mar 1.5, Apr 1.6, May 1.4, Jun 2.2, Jul 2.5, Aug 2.3, Sep 1.7, Oct 1.5, Nov 2.1, Dec 2.0. Dark blue solid line (line width 2px). Data points: white-filled circles with blue borders, size 10px. Pure white background, light gray thin grid lines. Clearly labeled axes. Bold title: Monthly Sales Line Chart of Kettle Products, 2025. Minimalist and intuitive style, high definition, no watermark.
How to: open the image generation page, set the model to “Puyo AI Standard”, enter the prompt, set the ratio to 4:3, the resolution to 2K, and the number of images to 1, then click “Create”.
Look at this round’s result—twelve months of data points, a dark blue solid line, light gray grid, matching the prompt item by item:
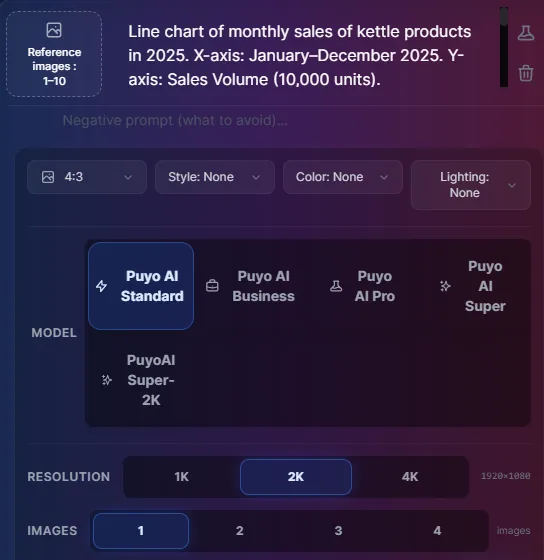
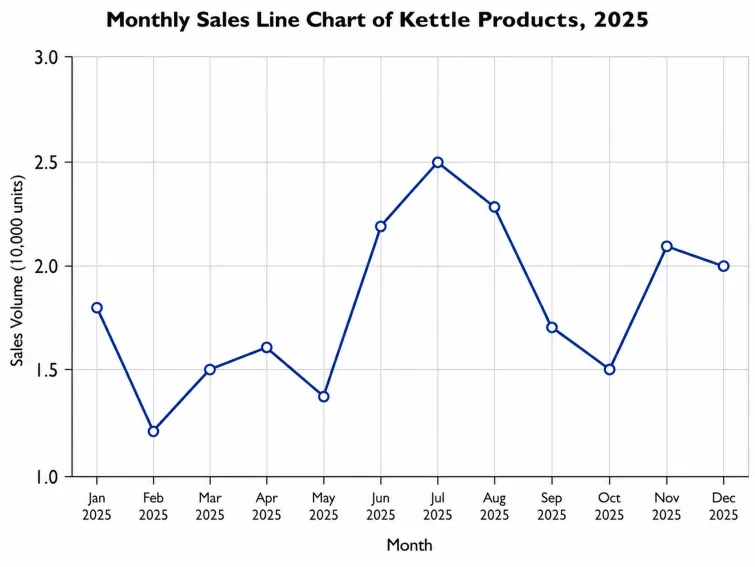
Fig. 1-6 Generating the kettle sales line chart
Advanced: Turn a Simple Chart into a Composite Analysis Chart
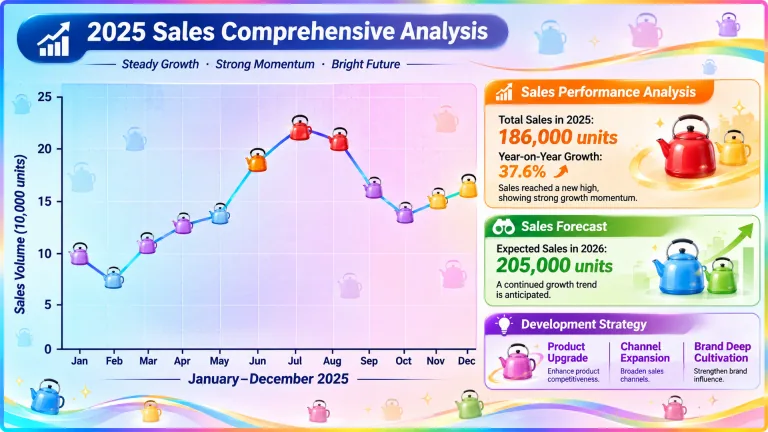
Once you have the line chart, you’ll notice a plain chart is too monotonous. No need to start over—edit the prompt to add text content modules, and a simple chart becomes a composite one, stepping up both information density and comprehension. The idea is “main chart on the left + per-module breakdown on the right”, with key data and conclusions highlighted in theme colors:
Vibrant polished business comprehensive analysis chart. On the left side is the main line chart with soft gradient background from light blue to light purple to light pink, overlaid with subtle frosted grid texture. X-axis labeled "January–December 2025", Y-axis labeled "Sales Volume (10,000 units)". The actual 2025 sales line uses cyan-blue gradient, line width 2.5px. Data markers are replaced with colorful cartoon kettle icons: orange-yellow and bright red kettles for peak season (June–August), warm yellow kettles for sub-peak season (November, December), pale blue kettles for low season (February, May), light purple kettles for slight growth periods. Three analysis modules on the right. Bold highlighted module titles in different colors: orange for Sales Performance Analysis, green for Sales Forecast, purple for Development Strategy. Key text highlights in matching theme colors: "186,000 units", "37.6%", "205,000 units", "Product Upgrade", "Channel Expansion", "Brand Deep Cultivation". Semi-transparent small colorful kettle decorations (red, yellow, blue, green, purple, pink) inside each module, not covering text. A thin rainbow border along the canvas edge. Tiny low-opacity kettle silhouettes scattered in blank areas. Maintain professional business report style, lively visual effect with colorful kettle elements and multi-color gradients. All core data and text are legible, high definition, for presentation display.
How to: run the same flow one more round, with the ratio changed to 16:9, resolution 2K, 1 generated image, then click “Create”.
Here’s what the finished piece looks like—the line chart’s data points on the left have become colorful kettle icons, and the three analysis modules on the right spell out full-year sales, forecast, and strategy; the three key figures of 186,000 units sold in the year, 37.6% year-on-year growth, and a projected 205,000 units in 2026 are visible at a glance:
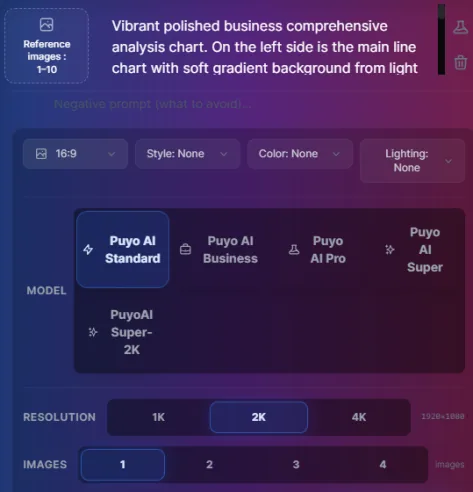
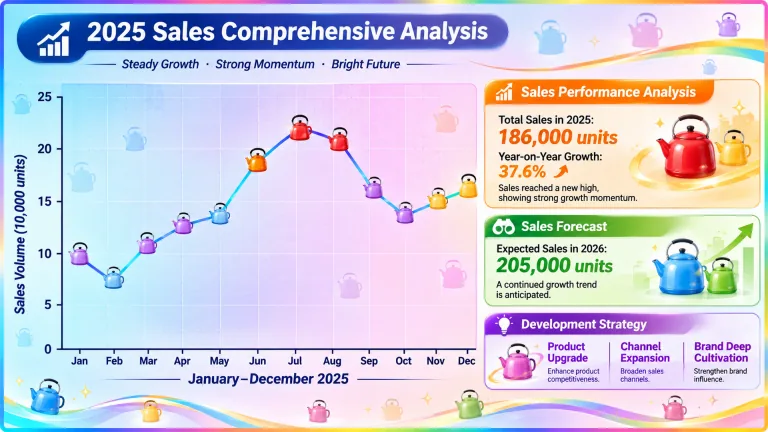
Fig. 1-7 Beautified composite analysis chart: a simple chart becomes a composite breakdown
The three-step workflow is now fully walked through: organize → choose → generate and refine, plus one round of beautifying additions. The next three guides hand you ready-made templates by scenario: for data comparisons see AI Bar and Pie Chart Generation: Sales Data Visualization Prompt Templates, for project progress see How to Generate Project Timeline Charts and Flowcharts, and for everyday needs see How to Make Promo Coupons and Character Breakdown Sheets.
FAQFrequently Asked Questions
The questions beginners ask most about this guide
Do I have to use Doubao to organize my document?
Not necessarily. Doubao, DeepSeek, and other popular AI assistants all work—use whichever you’re comfortable with; the key is condensing the document into “useful text + data”. The output of this step is the raw material for your image prompt.
What happens if I pick the wrong chart type?
Your expression efficiency drops sharply. Trend data in a pie chart or share data in a line chart is very hard for readers to parse; when choosing, consult the pros-and-cons table of chart types, pick the best fit for your “scenario + need”, and if unsure, first get clear about the conclusion you want to convey.
Do I need to write specific numbers in the prompt?
Writing them is recommended. With data like “Jan 1.8, Feb 1.2” spelled out, the AI can draw true proportions; if you’re only describing logical relationships, at least state the data dimensions and value relationships (magnitude, share, trend)—never just vaguely say “draw a sales chart”.
How do I set the aspect ratio and resolution?
Decide by use. Regular report charts use 4:3 or 16:9, and 2K resolution is sharp enough; for mobile-first sharing, choose a portrait ratio. In this guide’s cases, the line chart uses 4:3 and the beautified analysis chart uses 16:9—both at 2K, 1 image.
The generated chart looks too plain—how do I beautify it?
Add to the prompt. On top of the original prompt, add a “main chart + per-module breakdown” structure, and specify module title colors, keyword highlights, decorative elements, and a gradient background—one revision round turns a simple chart into a composite analysis chart.
Can I process confidential documents this way too?
Desensitize first. Replace internal company data with sample values or ranges before uploading and organizing; the chart structure and expressive logic are unaffected, and the generated chart makes its point just as well.
About the Author: Julia, Veteran AI Image Creator
Julia has long used AI image tools for avatars, illustrations, productivity diagrams, and character design, and has coached large numbers of complete beginners. Every case, prompt, parameter, and screenshot in this article comes from real generation records on the Puyo AI platform—not theoretical speculation, not stitched-together stock. This guide is the method page of the chart-making series; once you’ve mastered the workflow, keep learning by scenario: bar and pie charts, timeline and flowcharts, everyday design.
The content is adapted and polished from the original material “From Novice to AI Art Pro | Complete Hands-On Tutorial Collection”, with all original prompts and figures preserved. Source: https://www.puyoai.com.
The Three-Step Workflow Is Complete
Open the Puyo AI website, apply the generation formula, and turn your document data into your first chart.
Results are affected by model version and randomness—the same prompt will vary slightly each time it runs; run it a couple of rounds before drawing conclusions.